A picture is worth a thousand words
We live in a world where we are literally inundated with images. Every day, billions of images are created, distributed and consumed. Whether it’s on the internet while reading websites, streaming films or uploading selfies to various social media platforms.
Unlike animals, humans are the only living beings that actively create images and consume them at the same time. The earliest images created by humans are around 73,000 years old [1]. Handprints and abstract paintings in caves show that images played an important role very early on. It is believed that these early images were not just representations of reality, but had an additional meaning: they were often perceived as the objects or beings they depicted [2].
The origin of pictures in business
While language must proceed step by step, pictures present information simultaneously and at a glance. They facilitate understanding, communication and collaboration, especially when it comes to bridging the gap between teams and subject matter experts.
In today’s IT landscape, pictures – as visual representations in the form of diagrams – play a crucial role. They can
- create order and clarity,
- make abstract relationships understandable,
- store and pass on knowledge,
- make complex tasks manageable, and
- structure and simplify communication.
To ensure that the creator of the image can be sure that the viewer really understands the image, a wide variety of notations have been developed over time. In the past, a wide variety of languages were developed. For example, the program flowchart [3] or the Nassi-Shneiderman diagram [4] were developed to document program sequences. Or the data flow diagram [5] to describe data flows.
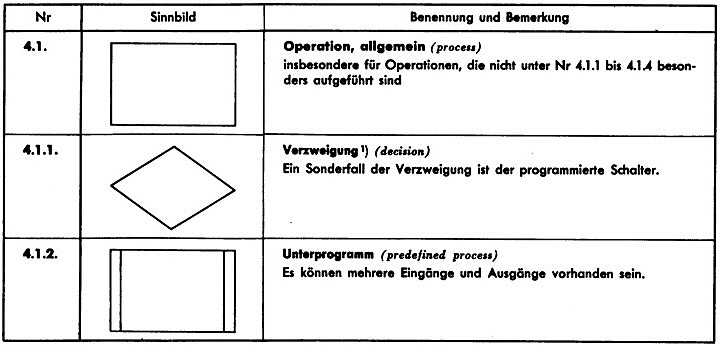
The oldest standard I am aware of dates back to 1966: DIN 66001 [6]. It was developed to standardise the creation of ‘symbolic representations’. This standard still contains elements that are common today, such as operations, branches and subroutines – building blocks that still play an important role in computer science.

Figure 1: Symbols for programme sequences from DIN 66001
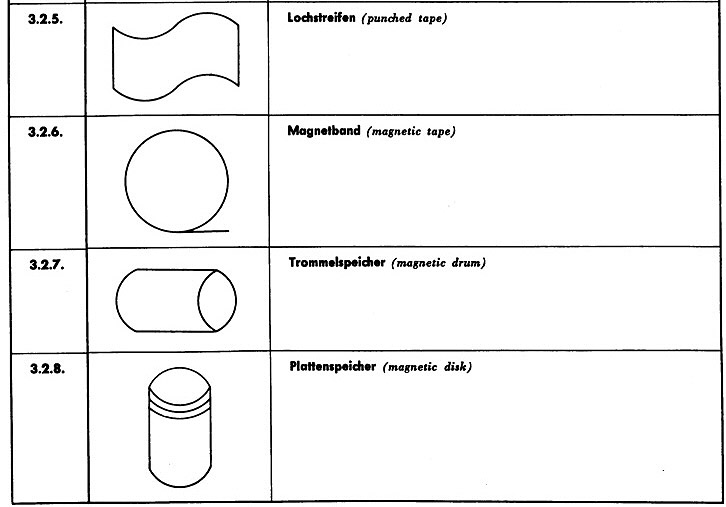
However, in addition to these rather timeless representations, this standard also defined elements that will only be found in museums (at least, I hope so).

Figure 2: Symbols for data flow diagrams from DIN 66001
Due to the increasing complexity of IT, the growing number of people working in or with IT, and the involvement of a wide variety of departments, the existing notation systems were no longer adequate. They were either unable to meet new requirements, were no longer up to date, or the target group had expanded.
Newer and more powerful languages were therefore developed, of which I would like to mention UML and BPMN here due to their widespread acceptance, but I am aware that there are many other languages.
The evolution of pictures
UML (Unified Modelling Language) and BPMN (Business Process Model and Notation) are central visual languages for modelling systems and processes. UML and BPMN diagrams serve as a common language between IT experts and subject matter experts and are established and widely used notations.
UML is the most widely used language for modelling software systems. It appeared in the 1990s and is maintained by the Object Management Group (OMG) [7] and standardised by the International Organisation for Standardisation [8]. The inventors of UML – also known as the Three Amigos [9] – wanted not only to merge several existing and partly competing systems into a uniform standard, but also to enable graphical notation of parts of the models in addition to their representation in the form of models.
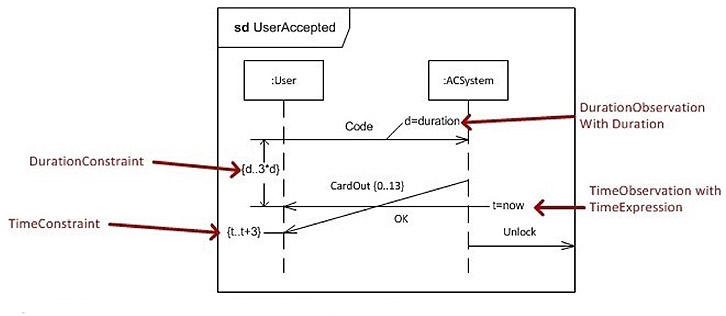
UML offers a wide range of diagrams for documentation, e.g. for classes, activities, communication, sequences or even statuses. In addition to these common elements, there are also others such as namespaces and packages for organisation or templates.

As another description language, BPMN offers a standardised notation for modelling business processes and facilitates the understanding and analysis of complex workflows. BPMN was developed by IBM employee Stephen A. White in 2004 and achieved standard status through the OMG in 2006.
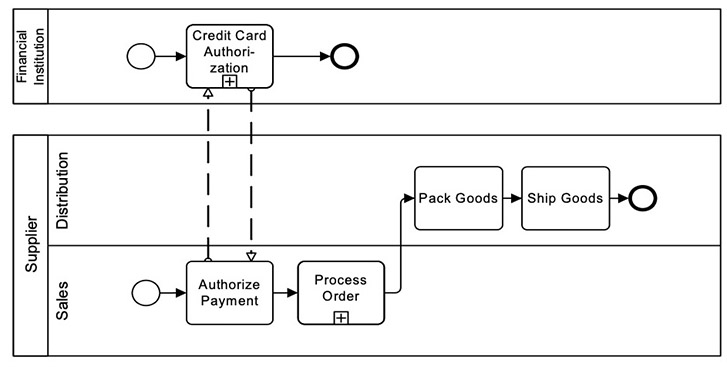
The main focus of BPMN is the representation of processes. This is done in the form of a business process diagram, which follows a simple basic structure:
- Nodes represent activities, branches or events, and these are connected by edges. In the following example, simple activities are ‘Pack goods’ or ‘Ship Goods’. Complex activities with several steps, such as ‘Process Order’, are recorded as sub-processes.
- These nodes and edges are grouped into areas and assigned to an actor. These areas are then called swimlanes.
- Multiple swimlanes form a pool, which can then be assigned to a system or organisational unit.
Business Process Diagrams (BPDs) are read from left to right, corresponding to the chronological sequence of activities, processes or events.

Figure 4: Example of BPMN with message flows connecting to flow objects with two pools [11]
However, UML and BPMN are not competitors, even though one might assume so, but rather complement each other. BPMN describes the business process (WHAT should happen?) and UML describes the implementation (HOW is it implemented?). UML can therefore be used to define the technical details for implementing these processes.
The (potential) power of pictures
Today, UML and BPMN are often used ‘only’ for presentation purposes, and users are usually only interested in the graphical representation, with the underlying abstract model being of secondary importance. This means that potential advantages are not exploited and the application is reduced to mere ‘drawing’ instead of ‘modelling’.
These description languages offer the following additional possibilities, for example:
- Exchange between different tools for further use
- Model-driven architecture [12] for generating artefacts based on the model
- Process optimisation
- Automatic validation with tools such as Enterprise Architect [13] or
- Automatic execution using BPEL [14] or business orchestration by Camunda [15].
Regardless of this, however, both languages help with the specification, design, documentation and visualisation of software and other systems. In addition, the models can be used in the same way by all stakeholders, even if the degree and purpose of use may vary.
The producers and consumers of pictures
Subject matter experts can use UML and BPMN depending on their personal knowledge. The basic elements are easy to learn, and after a brief explanation, these simple elements can be combined to create and document complex relationships. But even if the creation of diagrams by subject matter experts is not necessarily the main focus here, a subject matter expert quickly gains a basic reading comprehension, which promotes the exchange of information.
Business analysts can use use case diagrams, for example, to depict the interactions between actors (users or other systems) and the system. This helps to provide an overview of the system functionalities, document requirements and coordinate these with subject matter experts. Business analysts can document individual steps in a process, depict decision-making paths and identify inefficiencies or potential for improvement.
Software architects can use diagrams to present system designs to non-technical stakeholders and ensure that the proposed solution meets business requirements and that the architecture supports it.
Software developers can use diagrams to implement coordinated requirements more independently during implementation with fewer queries. In addition to the purely textual information in user stories, diagrams can provide the necessary overview of processes and workflows at interfaces between systems or relevant details such as status diagrams or data models. These additions enable developers to complete the planned work independently and with fewer (or no) queries.
Security officers such as CISOs or security engineers could use diagrams in various ways to visualise, plan and manage information security. A CISO can use diagrams to explain complex security concepts and issues in an understandable way and to highlight the need for investment in security.
The danger of pictures
Despite all the advantages, potential disadvantages and limitations should not be overlooked:
- Diagrams may lack the precision and depth of detail required for complex logical relationships. UML and BPMN diagrams may not capture all the nuances of a system or process if they are overly simplified.
- Overreliance on visual elements can lead to oversimplification. Complex problems may be reduced to easily digestible but ultimately inadequate diagrams.
- Excessive use of the tools’ capabilities can also have the opposite effect, creating distance from the subject matter expert. You should not exploit all the possibilities of UML or BPMN, as this will transfer the technical jargon into a new language – the jargon of UML and BPMN.
- Creating and maintaining detailed UML and BPMN diagrams can be time-consuming, especially for large and complex systems. If the effort outweighs the benefits, it may not be a worthwhile investment.
- Over-reliance on tools can create a dependency on specific software and potentially hinder flexibility and collaboration if stakeholders use other tools or prefer simpler methods. Or financial aspects such as acquisition and licensing costs may prevent widespread use.
And last but not least, text or language can convey something in numerous contexts that is very difficult, if not impossible, to convey with images.
Conclusion
Visual representations are indispensable in IT. UML and BPMN offer valuable tools for modelling complex issues and improving communication between technical teams and specialist departments.
However, the power of images also harbours dangers. Images can simplify and abbreviate. It is therefore crucial to use visual models in conjunction with textual documentation and verbal communication to ensure a comprehensive understanding of the system.
Through the conscious and critical use of images, IT projects can be made more successful and collaboration with all stakeholders optimised. However, it is important to be aware of the potential disadvantages and to supplement visual models with other forms of communication to ensure a comprehensive understanding.
Notes (some in German)
If you are interested in further information and perspectives on modelling, business analysis, cloud technologies or quantum computing, then Gottfried Szing’s blog is definitely worth a look: https://kjoo.be.
[1] ARD alpha: Die aeltesten Wandbilder der Welt
[2] Britannica: Cave Art
[3] Wikipedia: Programmablaufplan
[4] Wikipedia: Nassi-Shneidermann-Diagramm
[5] Wikepedia: Datenflussdiagramm
[6] Informationsverarbeitung Sinnbilder für Datenfluss- und Programmablaufpläne
[7] Object Management Group (OMG)
[8] International Organization for Standardization (ISO)
[9] Three Amigos
[10] Beispiel für Sequenzdiagramm aus der UML
[11] Beispiel aus der BPMN-Norm
[12] OMG: The Architecture of Choice for a Changing World
[13] Enterprise Architect
[14] BPEL
[15] Camunda
If you like the article or would like to discuss it, please feel free to share it in your network. And if you have any comments, please do not hesitate to send us a message.
Gottfried Szing has published two more posts on the t2informatik Blog:

Gottfried Szing
Gottfried acts as a “translator” and “departmental understanding” who mediates between the individual groups of people and contributes to the solution. He is a founding and board member of DLT Austria, an association for the sustainable promotion of distributed ledger technologies in Austria. He is also a co-founder of the Meetup groups Domain-Driven Design Vienna and Microservices, Reactive and Distributed Systems Vienna, both of which aim to build better software.
In the t2informatik Blog, we publish articles for people in organisations. For these people, we develop and modernise software. Pragmatic. ✔️ Personal. ✔️ Professional. ✔️ Click here to find out more.

