What is a Problem Tree?
Problem tree – getting to the bottom of the causes and effects of a problem
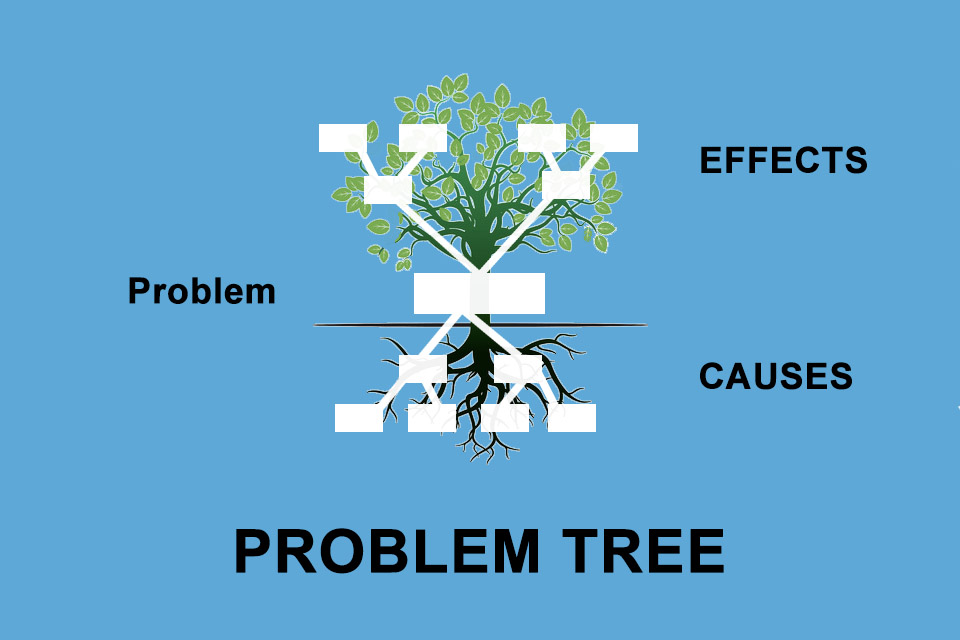
The problem tree is a cause-and-effect diagram in the form of a tree: the problem definition is located in the trunk of the tree, the roots visualise the causes of the problem and the branches represent the effects. The aim is to understand a problem in all its depth and breadth and to use this knowledge to identify one or more solutions that can be used to eliminate the causes and solve the problem.
Procedure for creating a problem tree
The procedure for creating a problem tree follows a clear process with
- preparation,
- implementation with identification of causes and definition of measures, and
- follow-up.
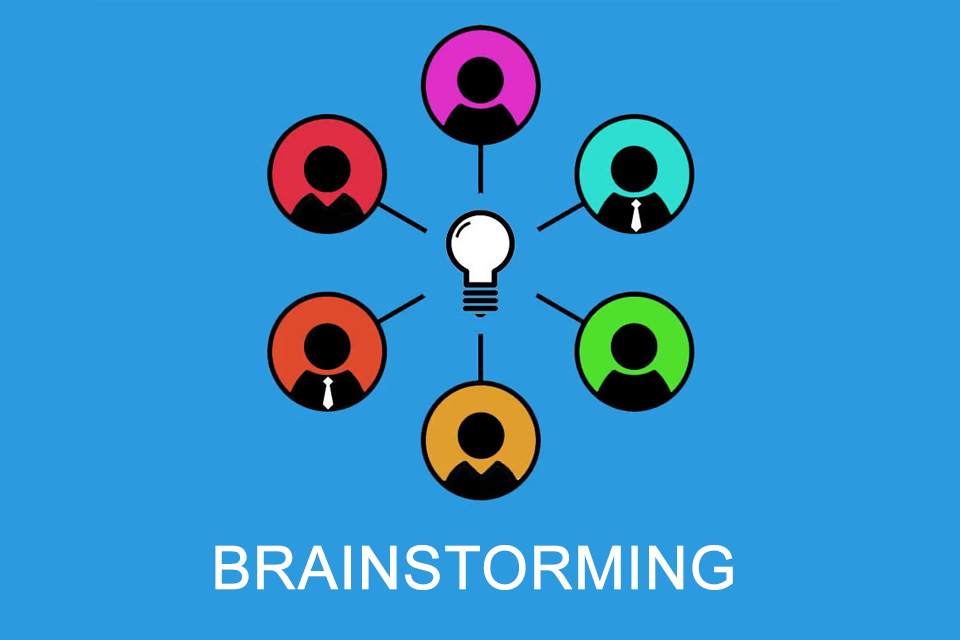
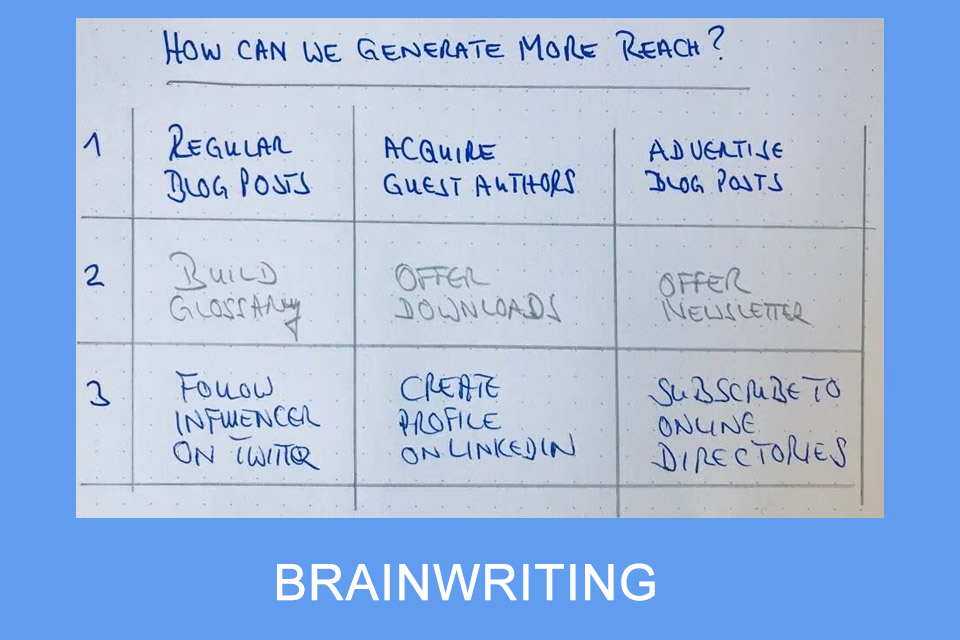
In terms of content, this involves briefly describing the procedure for all those involved in the exchange, defining a timebox, naming and documenting the problem and determining the format for the exchange – e.g. brainstorming, reverse brainstorming or brainwriting.
This is followed by the actual exchange. Here, the moderator should ensure that all participants have their say and that all perspectives are documented. Once the causes and effects have been collected (and grouped if necessary), the causes are prioritised. What is the most important cause, which causes contribute significantly to the problem? Ideas for measures must be collected for these “central” causes, these must of course be prioritised again and a procedure for implementing the measures must be agreed.¹
The follow-up phase involves planning and implementing the agreed measures and monitoring their success. If the measures have the desired effect, the problem is solved; if they do not have the desired effect, alternative measures should be considered, planned and implemented if necessary.
Advantages and disadvantages of the problem tree
Visualising a problem with its causes and effects using a problem tree has several advantages:
- The method is easy to understand and comprehend.
- The method enables the grouping of causes – several aspects add up to one cause – and the grouping of effects.
- The method allows the “free” collection of causes and effects, i.e. the participants in an exchange can give free rein to their perspectives and thoughts.
These advantages are offset by some disadvantages:
- Although the visualisation of the problem tree is simple, it is only helpful to a limited extent, as it is difficult to directly assign a cause to an effect – e.g. by highlighting it in colour. If this assignment is not possible, why are the effects shown separately at all?
- The presentation of several equally weighted effects that can be attributed to one cause is only possible via “detours”.
- The more causes and effects there are, the more confusing the presentation becomes.
- On the one hand, “free” association is an advantage, on the other hand, there may be a lack of structure, such as the Ishikawa diagram with the 8M method.²
And last but not least: Understanding a problem with its causes and effects is very important for developments and projects. But it is only half the battle, because the real goal is to find a solution. And how do you visualise this solution?
Tips for using the problem tree
In addition to the already indirectly mentioned tip of using different coloured post-its or cards, there are two essential tips for using the problem tree:
- Define a solution tree parallel to the problem tree. This solution tree mirrors the problem tree and shows measures to eliminate or minimise the causes and compares positive and negative effects.
- Reverse the approach of the problem tree from the outset and formulate the problem positively as a solution. This eliminates the subsequent mapping of causes and measures and places the solution at the centre of the exchange right from the start. In addition, the reverse formulation breaks up ingrained thought patterns and promotes unexpected insights.
Of course, it makes sense to keep the created problem tree in order to be able to continuously develop it further if required, e.g. if new cause-effect relationships arise in the course of a project.
Impulse to discuss
When does it make more sense in practice to simply use a table to collect causes and effects instead of a problem tree?
Notes:
If you like the article or would like to discuss it, please feel free to share it in your network. And if you have any comments, please do not hesitate to send us a message.
[1] In theory, this often sounds easier than it is in practice. It can be useful to arrange a separate meeting to ensure that truly targeted and realistic measures are considered.
[2] The Ishikawa diagram is also a tool for systematically identifying and analysing the causes of problems and developing solutions. In contrast to the problem tree diagram, the Ishikawa diagram – which is reminiscent of fish bones – uses 8 predefined categories to identify causes in a structured way. Some places on the internet claim that the two cause-and-effect diagrams only differ visually – this statement should be treated with caution.
[3] The described reversal is also used in the headstand technique.
Here you can find a problem tree template for the online collaboration platform Miro.
And here you can find additional information from our Smartpedia section:


