What is the Ishikawa Diagram?
Table of Contents: Definition – Structure – Advantages and disadvantages – Questions from the field – Notes
Smartpedia: The Ishikawa diagram is a tool for systematically identifying and analysing the causes of problems and developing appropriate solutions.
Ishikawa diagram – systematically identifying the causes of problems
The Ishikawa diagram was developed by Kaoru Ishikawa¹ in 1943. Ishikawa was a chemist, organisational theorist, professor at the technical faculty of the University of Tokyo and a pioneer in the use of statistical methods to improve production processes.
The Ishikawa diagram – also known as a cause-and-effect diagram or fishbone diagram – is based on the concept that problems often have multiple causes that are organised into different categories. It is part of the “Seven Tools of Quality”, a collection of quantitative methods and tools for quality assurance defined by Ishikawa.²
The Ishikawa diagram was originally introduced in quality control to analyse the causes of problems in the manufacturing industry and production. Today, it is used in a wide range of industries and situations, for example in project management to recognise potential risks and problems in projects at an early stage, in process optimisation to analyse inefficient processes and develop improvement measures, or in product development to develop ideas for the implementation of features.
The structure of the Ishikawa diagram using 4M, 5M, 6M, 7M or 8M
The Ishikawa diagram visualises relationships between cause and effect. Originally, the causes were divided into four categories or main influencing variables – the so-called 4M scheme:
- Material,
- Machine,
- Method and
- Man.
Material includes workpieces, raw materials, auxiliary materials and lubricants as well as vendor parts. Machine refers to workplace design, work equipment and measuring devices. Method includes work processes, instructions, organisational structures and control procedures. And man refers to experience, knowledge, skills and personal attitudes.
Over time, the original 4M scheme was successively expanded into an 8M scheme – also known as the 8M method.
- Milieu or environment (5M),
- Management (6M),
- Measurement (7M) and
- Money (8M).
Milieu or environment refers to the behaviour of customers, legal and social requirements and the competition. Management includes vision, mission, corporate principles as well as operational and strategic decisions. Measurement refers to output, results and performance. Money relates to finances.
The Ishikawa diagram is created in five steps:
1. drawing the diagram and entering the main influencing factors
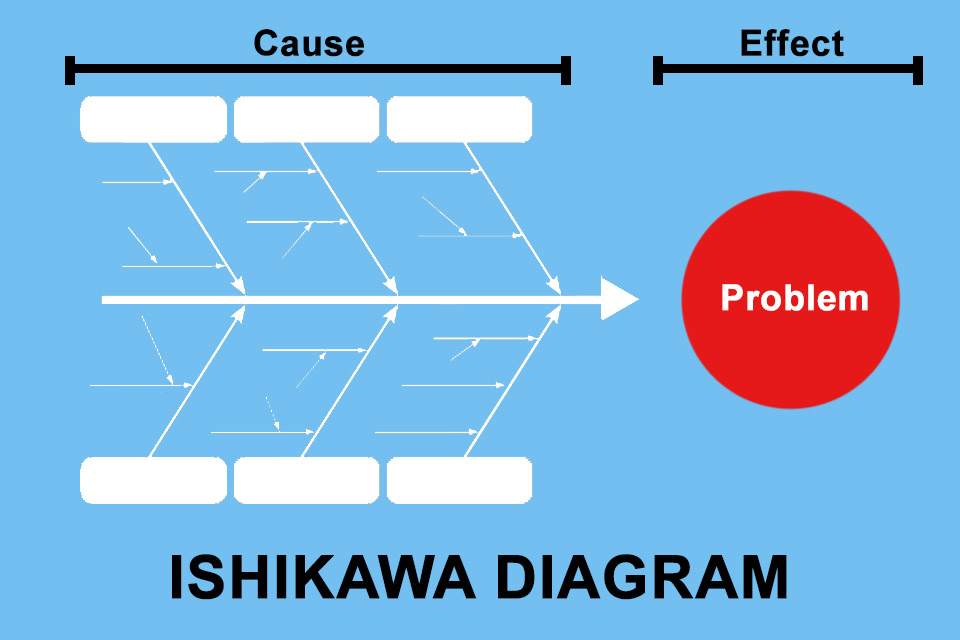
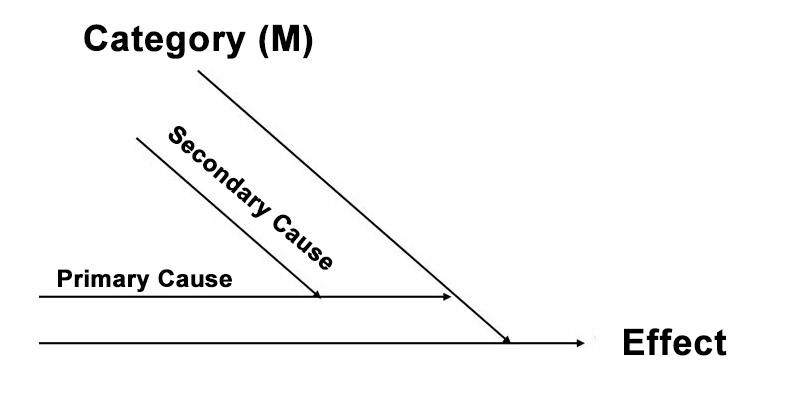
A horizontal arrow pointing to the right forms the starting point. At the tip of the arrow is the identified and clearly formulated goal or problem. The diagonal arrows represent the recognised or suspected main influencing variables.
2. developing primary and secondary causes
Potential causes are sought through the use of creativity techniques. As a large number of factors are often found in practice, it makes sense to identify the primary causes – e.g. using the ABC analysis – and to evaluate the influence of the causes – e.g. from A (strong) to C (low).
The primary causes are represented by smaller, horizontal arrows that run towards the diagonal arrows of the main influencing variables. Secondary causes point with diagonal arrows to the horizontal arrows of the respective primary cause and thus create further ramifications.
A category can have several primary causes and a primary cause can in turn have several secondary causes. All diagonal arrows point in the direction of the effect or result. This creates the pattern of a fish skeleton, which gives rise to the alternative names fishbone diagram or fishbone diagram.
3. checking completeness
The visualisation provides an overview and makes it easier to check whether all possible causes have been taken into account. It is checked whether causes have been overlooked or whether further correlations can be assumed.
4. evaluating the causes
The visualised potential causes are weighted according to their significance and influence on the problem. The cause with the highest probability is determined.
5. verifying correctness and deriving measures
The most probable cause is then checked with the appropriate expertise and assessed in terms of its impact on the problem. Statistical tests such as a significance test can support the assumption that the identified cause is the primary one. Once the cause has been recognised, measures are derived to solve the problem.
Advantages and disadvantages of the Ishikawa diagram
Working with the Ishikawa diagram or the Ishikawa method offers a number of advantages:
- The defined categories make it easier to collect and classify causes.
- A deeper understanding of the problem or challenge is gained.
- The visualisation of the relationships between cause and effect is easy to create and easy to understand.
- The prioritisation of causes facilitates the definition of measures. In terms of risk management, for example, the probability of risk occurrence or the extent of damage can be reduced.
- The diagram can be used in many areas and situations.
If the method is used in a team, there is also the chance that a “we-feeling” is created within the group and cohesion increases, as cause and effect are identified together and measures are defined.
However, there are also some disadvantages to working with the Ishikawa diagram:
- Temporal dependencies are difficult or impossible to visualise. It is also almost impossible to visualise interactions between different causes.
- The more primary and secondary causes are identified, the more confusing the visualisation becomes.
- The creation of a visualisation can be relatively time-consuming, especially if the causes of a problem or challenge are extensive.
- There is no guarantee that all causes will actually be identified.
- It may not be possible to clearly categorise all causes.
In addition, the joint result also depends on the cooperation in the collection of causes or ideas and the handling of different perspectives.
In short, the Ishikawa diagram is a useful and easy-to-create and understand tool for systematically analysing problems and developing targeted solutions. Through the structured recording and visualisation of causes, it provides a framework for effective problem-solving processes in various contexts. However, like many visualisation tools, it can become confusing when dealing with extensive problems or tasks. And, of course, there is no guarantee that all cause-and-effect relationships will be identified or that suitable solutions will be developed.
Questions from the field
Here you will find some questions and answers from the field:
What tips exist for creating the Ishikawa diagram?
- Appoint a moderator who ensures that the task is adhered to, all participants are heard and every perspective is documented.
- Communicate the task or the problem to be solved in advance of the exchange so that all participants can prepare themselves. This gives introverted people in particular the chance to actively participate in the dialogue. If necessary, choose a method for finding ideas or causes that works equally well for all participants. Brainwriting may work better than brainstorming.
- Allow sufficient time. It makes little sense to overlook measures because not enough time has been planned to identify all the key ideas or causes. If in doubt, postpone to a new date.
- It is better to use one category too many than one too few.
- Combine the Ishikawa method with other methods to really find all the key ideas or causes.
- New cause-effect relationships may emerge in the course of a development. If necessary, add to the diagram and derive additional measures.
And last but not least: try to use clear and precise wording. This makes it easier to understand and increases the readability of the diagram.
What other methods can the Ishikawa method be combined with?
The Ishikawa method can be combined with a whole range of methods. For example, there are numerous ideation approaches such as reverse brainstorming, scamper or the 5W1H method, which can be used to easily collect ideas or causes. In addition to the ABC analysis, there are also alternative approaches to prioritisation, such as the Eisenhower Matrix, the Pugh Matrix or the decision tree, which can be easily combined.
How can you ensure that all important causes are identified using the Ishikawa method?
Neither the Ishikawa method nor any other approach can ensure that all important and significant causes or ideas are identified. Methods are tools for solving a task, for example; they can never guarantee a result.
In practice, it is therefore advisable to
- allow sufficient time and listen to all participants and their perspectives, as well as
- use additional methods such as starbursting or 5-Whys.
Overall, the chances of finding many essential causes or ideas are then quite good.
How often is the Ishikawa diagram created?
The diagram is created once, but it can be added to in the course of a development or when new cause-and-effect relationships arise. This makes it a continuously useful tool.
Which software supports the creation of Ishikawa diagrams?
There are several tools that offer templates for the fishbone diagram. Here you will find a small list:
You are sure to find other tools or templates on the Internet.
How important is the visualisation of cause and effect in practice? Or to put it another way: Would a tabular representation be just as good?
Notes:
[1] A short biography of Kaoru Ishikawa.
[2] The “Seven Tools of Quality” – also known as Q7 for short – retain the check sheet or tally sheet, the histogram, the Pareto diagram, the correlation or scatter diagram, the control chart and the flow chart, as well as the Ishikawa diagram, of course.
[3] Nowadays, many organisations extend the M-scheme according to their specific circumstances and consider additional influencing variables such as information or processes.
Here you can find a video explaining the Ishikawa diagram in German.
If you like the article or would like to discuss it, please feel free to share it in your network. And if you have any comments, please do not hesitate to send us a message.
And here you can find additional information from the t2informatik Blog:


