What is a Gantt Chart?
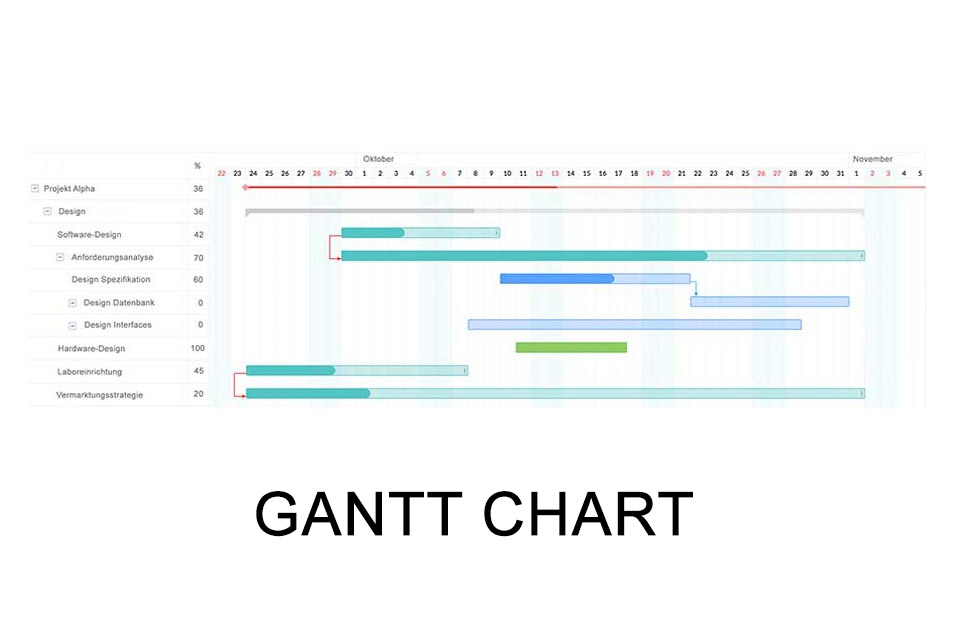
Smartpedia: In projects, a Gantt chart visualizes the sequence of activities on a time axis. It helps with project structuring and project control.
Gantt chart – the sequence of activities on a time axis
A Gantt chart visualizes a sequence of activities on a time axis. It is an instrument of time planning and is an important tool for planning and controlling projects and developments in many project management organizations.
In a Gantt chart the following are displayed:
- activities including name, start date, duration and end date,
- relationships between activities (the so-called arrangement relationships),
- and the names of the agents of the activities.
In addition, numerous software programs also visualize
- processing states and degrees of completion,
- offer support in resource planning, effort planning, cost planning
- and link the time recording.
The content of the Gantt diagram is based on a project structure plan, which divides the project into possible subprojects, subtasks and work packages, so that project phases and milestones can often be found in the display. The duration of the activities is illustrated by bars – therefore a Gantt chart is also called a bar chart.
Advantages of Gantt charts
Today, the Gantt chart is used in many projects because it shows
- a quick overview of the activities of a project,
- the duration of the activities,
- the relationships between the activities (usually shown with connecting lines),
- the critical path,
- and possible buffer times
and it is easy
- to create,
- to maintain
- and to understand.
In the context of agile approaches, there are always discussions as to whether the Gantt chart is a useful tool. Jeff Sutherland, the co-founder of Scrum, saw no benefit for its use in agile projects. However, as many organisations pursue hybrid project management approaches alongside traditional ones, the Gantt chart is still actively used today.
Gantt chart software
With suitable project management software, a Gantt chart can be created quickly and easily. Practically all project management software supports scheduling with the Gantt chart. Here you will find a list of programmes that offer Gantt charts:
- ProofHub
- Easy Project
- Monday.com
- ibo
- Workzone
- teamgantt
- tableau
- Wrike
- airfocus
- Rational Plan
- edraw
- ProjectLibre
- celoxis
- smartsheet
- Hansoft
- Merlin Project
- smartdraw
- Agantty
- paymo
- Planview
- Matchware
- Bitrix24
- Meisterplan
- Gantter.com
- Office Timeline
- Inloox
Of course, the list could easily be extended.
Many other techniques are used in agile projects, such as user story mapping or backlog refinement. Why might it also make sense to use a Gantt chart?
Notes:
If you like the article or would like to discuss it, please feel free to share it in your network. And if you have any comments, please do not hesitate to send us a message.
Here you can find additional information from our t2informatik Blog:


