
What is a Balanced Scorecard?
Table of Contents: Definition – Importance – Approach – Examples – Advantages and disadvantages – Questions – Notes
Balanced Scorecard: Managing with key figures
A managing director is poring over the balance sheet and notes: ‘The figures look sound.’ Yet no one in the company can really say whether the actual strategy has made any progress as a result. Customer satisfaction is not tracked anywhere, and whether internal processes have actually become faster can only be surmised. This is precisely where the Balanced Scorecard comes in.
As a system of key performance indicators, the Balanced Scorecard maps the performance of an organisational unit – such as a company, a department or a project – from four perspectives simultaneously. It serves to communicate an organisation’s strategy to stakeholders in a clear and comprehensible way and to monitor its implementation on the basis of success factors. In project management, it is suitable both for managing individual, larger projects and for multi-project management, where several projects need to be aligned with a common corporate strategy.
The method was developed by Robert S. Kaplan and David P. Norton. It has its origins in a one-year, cross-organisational study carried out in 1990 on behalf of KPMG through its research arm, the Nolan Norton Institute. Around a dozen companies from the manufacturing and service sectors collaborated to investigate how business performance could be measured beyond purely financial indicators. Kaplan and Norton published their findings in 1992 in the Harvard Business Review [1]. The very title of the article, ‘Measures That Drive Performance’, sums up the basic idea: what a company measures also determines where it directs its efforts.
- The Balanced Scorecard translates a corporate or project strategy into concrete, monitorable key performance indicators.
- It takes into account four equally important perspectives simultaneously, not sequentially.
- It was developed in the early 1990s by Robert S. Kaplan and David P. Norton.
- It replaces neither cost and performance accounting nor strategy development itself.
- Its structure follows a fixed process: from strategy, through objectives and key performance indicators, to ongoing monitoring.
Why the Balanced Scorecard is important
Anyone who focuses exclusively on financial indicators such as turnover or return on investment will always see only the outcome of past decisions, never the causes of future success or failure. The Balanced Scorecard addresses this blind spot by giving customer, process and development metrics equal weight alongside the financial perspective. This provides managers with a concise overview that shows, on a single page, just how effectively the strategy is actually working, rather than merely asserting it on paper.
This proves particularly valuable in larger projects and in multi-project management. Individual project progress can thus be directly linked back to overarching strategic objectives, rather than being assessed in isolation according to the project’s own internal criteria. Any manager or project leader who regularly has to explain how their own area contributes to the overall strategy will find the Balanced Scorecard to be a tool that makes precisely this connection visible.
However, it is also important to draw a distinction that is often overlooked: the Balanced Scorecard makes an existing strategy measurable, but does not itself develop a new strategy. Those who have not yet formulated a strategy at all are initially better served by strategy development methods such as a SWOT analysis, which systematically compares strengths, weaknesses, opportunities and threats. Only once the direction has been established does the Balanced Scorecard realise its true value as a management tool.
How does the Balanced Scorecard work?
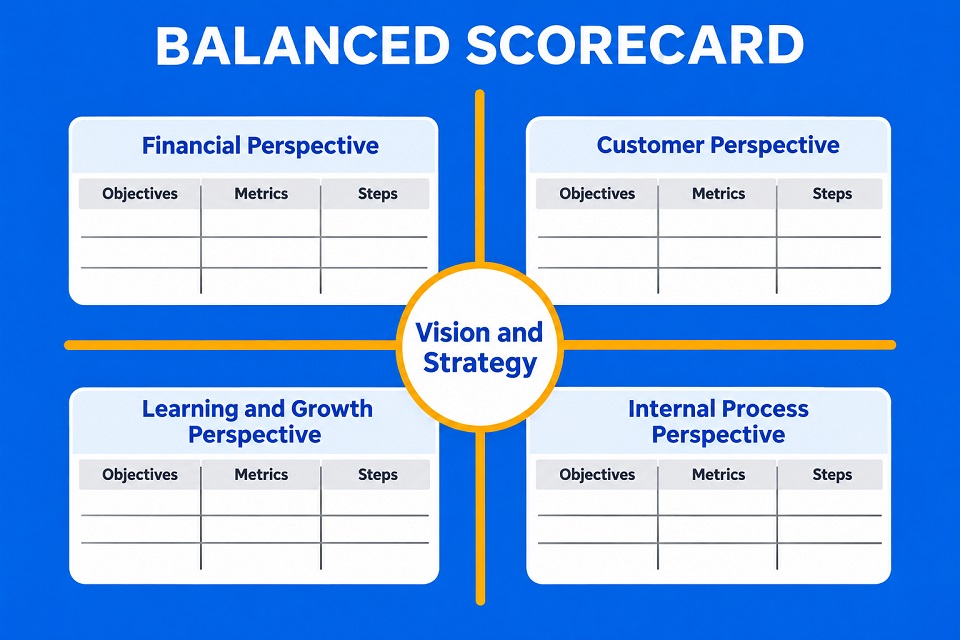
The structure of a Balanced Scorecard follows a clear path from strategy to ongoing monitoring. At its heart are always the four perspectives, from each of which specific guiding questions can be derived.
Financial perspective: This reflects key performance indicators that matter from the perspective of shareholders and investors. The key question is: How must we conduct ourselves towards our stakeholders in order to demonstrate financial success? Typical indicators include turnover, return on investment, cash flow and share price.
Customer perspective: This captures how an organisation is perceived by customers and the market. The key question is: How must we behave towards our customers in order to realise our vision? Examples include customer satisfaction, repeat business rate and brand awareness.
Internal process perspective: This measures how well the organisation’s own processes function. The key question is: In which processes must we excel in order to satisfy customers and investors? Key performance indicators here include lead time, rework rate and productivity.
Learning and development perspective (sometimes also referred to as the innovation or employee perspective): This reflects the capacity for change and growth. The key question is: How do we foster our potential for improvement and growth? Examples include the number of newly developed products, patents or days spent on further training.
Specific targets are first derived from the strategy for each of these four perspectives, formulated according to the SMART formula and limited to one’s own area of responsibility. Suitable key performance indicators are then identified or developed for each target. A series of guiding questions helps with this:
- What exactly is being measured?
- Which target does the key performance indicator relate to?
- How much effort is required to collect the data?
- And is achieving the target actually within one’s own sphere of influence?
Key performance indicators can also be categorised by type, such as absolute figures, ratios or relative values. Furthermore, a distinction is made as to whether they serve as leading indicators, signalling future developments, or as lagging indicators, reflecting results already achieved. The number of trade fair visitors to a stand, for example, is a leading indicator of future order intake, whilst turnover or market share are classic lagging indicators.
From the wealth of possible key performance indicators, an organisation usually selects 15 to 20 of the most meaningful ones. Three criteria guide this selection:
- Similar key performance indicators are grouped together.
- Strategically significant key performance indicators are given priority over those relating to one-off activities.
- The selection is distributed evenly across the four perspectives.
The cause-and-effect relationships between the key performance indicators are then identified. Progress in learning and development typically improves internal processes, which in turn increases customer satisfaction. Ultimately, this is reflected in improved financial performance.
For each key figure, target values and timelines are then set, for example based on historical data, benchmarks from comparable organisations or expert estimates. The final scorecard is then linked to specific actions and employees’ performance targets, ensuring that each key figure remains within the organisation’s sphere of influence. A simple traffic-light system has proved effective for ongoing monitoring: green, amber or red show at a glance where an organisation stands in relation to its target values and where corrective action is needed.
Key point: Kaplan and Norton summarised their fundamental principle succinctly in 1992: “What you measure is what you get.” [1] Put simply: what a company measures is what it gets, for better or for worse. An organisation’s measurement system shapes how managers and staff act, going far beyond the mere documentation of results.
Examples of the Balanced Scorecard
The best way to illustrate what a Balanced Scorecard actually looks like is through examples from different sectors.
A medium-sized engineering firm uses the financial perspective to increase the proportion of recurring service revenue in its total turnover, rather than relying solely on the sale of new equipment. In the customer perspective, an insurance company tracks the contract renewal rate as an early indicator of long-term customer loyalty, long before this is reflected in the annual turnover figures.
This principle can be illustrated particularly clearly using the example of an in-house software development department, which is run as a separate cost centre or profit centre in many larger companies. From a process perspective, such a department might set itself the target of increasing the proportion of projects implemented using agile methods to more than half within three years. This is measured by the number of completed sprints per team per month. From a learning and development perspective, one could additionally track how many team members obtain certification in agile methods during the same period. Both metrics are interlinked: having more trained staff generally facilitates a faster and more reliable transition to agile working practices.
From the customer perspective within the same area, the focus could be on the proportion of change requests implemented within the project timeframe. A conceivable target would be to increase this to 70 per cent within three years. A concrete measure to achieve this could be to set up an internal knowledge database through which sales and project teams can access up-to-date customer information at any time, rather than having to research each enquiry from scratch.
Advantages and disadvantages
Like any management tool, the Balanced Scorecard has both strengths and clear limitations.
The advantages include:
- It focuses on the key performance indicators and thereby consistently aligns the critical success factors with the strategy.
- It provides a quick overview, as the key performance indicators for strategy implementation can be presented on a single page.
- It is easy to understand and is therefore well suited to communication with various stakeholders.
- It can be flexibly adapted to a wide range of business requirements, from the departmental level right up to the group level.
The following are considered to be disadvantages or limitations:
- It supplements an existing strategy by adding a key performance indicator perspective, but does not develop the strategy itself.
- It replaces neither cost accounting nor performance accounting; it is too imprecise for that and does not reflect tax or commercial law aspects.
- It does not automatically display all key performance indicators relevant to management; supplementary metrics are often required for individual sub-areas.
- If it is misused, for example to push through corporate policy interests, it quickly loses acceptance amongst the workforce.
Ultimately, the Balanced Scorecard works best where an organisation already has a clear strategy and now wishes to make this visible and verifiable, rather than as a substitute for missing strategic decisions.
Frequently asked questions from practice
Here you will find some questions and answers from practice:
Can a Balanced Scorecard also be created for a single team or a small project, rather than just for an entire organisation?
The basic principle works regardless of the size of the organisational unit. The only prerequisite is that a separate, albeit compact, strategy can be formulated for the team or project. For very small units, it is worth keeping the number of key performance indicators well below 15, so that maintaining the scorecard does not involve more effort than the benefits justify.
Does a Balanced Scorecard always have to give equal weighting to all four perspectives?
No, the weighting may be based on the actual strategic focus. The only important thing is that no perspective is completely omitted, as it is precisely this balance across all four perspectives that distinguishes the method from a purely financial or customer-focused key performance indicator system.
How often should the key performance indicators on a Balanced Scorecard be reviewed?
Individual key performance indicators can be collected monthly, quarterly or annually, depending on how quickly a value is likely to change in a meaningful way. However, the scorecard as a whole, including the objectives and target values, should generally be reviewed at least once a year, particularly if the underlying strategy changes.
Who should be responsible for collecting the key performance indicators within a company?
In practice, this is often handled by the controlling department, as it has the appropriate tools and experience in dealing with key performance indicators. Nevertheless, responsibility for the content of a target and its associated key performance indicator should lie with the relevant specialist department; otherwise, the scorecard will quickly lose its connection to day-to-day work.
How many key performance indicators are too many?
There is one question that can rarely be answered conclusively in advance: where does sensible management by key performance indicators end, and where does a culture begin in which people merely measure rather than actually work? This line is particularly difficult to draw in software development. Velocity, lead times, error rates, test coverage, number of completed sprints: there is a sound rationale for each and every one of these key performance indicators. Taken together, however, they can tempt a team to optimise for the numbers rather than the actual objective behind them.
Whilst the Balanced Scorecard mitigates this risk by stipulating that teams should limit themselves to 15 to 20 key metrics, this is no guarantee against becoming fixated on numbers. A team that is measured exclusively against a single process metric will almost always find a way to improve that figure, even if the underlying intention falls by the wayside in the process. Anyone introducing or revising key performance indicators within their own team or organisation would therefore be well advised to ask themselves regularly: Does a key performance indicator still reflect the original objective, or has it long since taken on a life of its own?
How does the Balanced Scorecard differ from OKR?
Objectives and Key Results (OKR) operates on short, usually quarterly cycles, during which teams set their own objectives and associated metrics, often in a decentralised, bottom-up manner. The Balanced Scorecard, by contrast, takes a longer-term view and firmly links the four perspectives to the overarching corporate strategy, usually with a more centralised, top-down approach. In practice, both approaches can also be combined, for example by using OKR cycles to bring individual Balanced Scorecard metrics to life in day-to-day operations.
Notes:
If you like this post or would like to discuss it, please feel free to share it within your network.
[1] Kaplan, Robert S.; Norton, David P.: The Balanced Scorecard: Measures That Drive Performance. In: Harvard Business Review, Vol. 70, No. 1 (January/February 1992), pp. 71–79.
Anyone wishing to explore the method in greater depth beyond this overview will find a detailed account in the seminal work by its two authors: Robert S. Kaplan and David P. Norton, The Balanced Scorecard: Translating Strategy into Action, Harvard Business School Press, Boston 1996.
Here you’ll find two interesting posts about Hunting for key figures and When key figures encourage wrong behaviour.
And here you’ll find more information from our Smartpedia section:

What is OKR?

How does one achieve a Change of Perspective?

What is the SMART Formula?
‘Smartpedia’ is our glossary for people in organisations involved in software development, project management and product management. It is for precisely these people and their organisations that we have been developing and modernising software since 2012. Pragmatic. ✔️ Personal. ✔️ Professional. ✔️
Get to know t2informatik from Berlin as your development partner.