
When key figures encourage wrong behaviour
Expand the table of contents
What matters is not the key figure alone, but the way it is constructed
What key figures can trigger in software development
When sales targets become the end in themselves
Why AI enables even more key figures
Four questions for every key figure
Good key figures help us understand
A retail chain wanted to reduce absenteeism amongst its trainees and introduced an attendance bonus to this end. One scheme offered a cash reward for attendance, whilst another offered additional time off. The idea sounds plausible at first glance: rewarding attendance should reduce absenteeism.
The field experiment ran for one year across 232 branches. However, neither of the two variants reduced absenteeism. With the cash bonus, the opposite actually happened: absenteeism rose by around fifty per cent, i.e. by more than five additional days per person per year. And even after the bonus had been abolished, part of this effect persisted. [1]
Prof. Dr Antoinette Weibel, Director of the Research Institute for Work and Working Environments at the University of St Gallen, uses this case to pose a further question: What impact does a key figure actually have when it is applied to people? [2]
This question is particularly relevant for organisations because performance indicators have long since ceased to merely document what has happened. They structure attention, influence decisions and set expectations. Particularly where work is intensively measured, key figures can thus themselves become part of the very system they are actually only supposed to observe. Software development is a particularly illustrative example of this.
- Key figures not only measure behaviour; they can also change it.
- What matters is not just what is measured, but how a key figure is used and who bears the risk.
- Good metrics help people to better understand their work. Poor metrics turn people into the objects of measurement.
- The easier it becomes to generate new key figures using AI and digital systems, the more important the question of their impact becomes.
When key figures create a new meaning
What had the attendance bonus changed? The bonus was intended as a token of appreciation. The message that came across, however, was a different one: attendance comes at a price.
As a result, something that had previously been taken for granted became a commodity. Those who were present were suddenly doing something extra for which they were remunerated. Those who were absent forfeited this remuneration and could therefore consider the matter settled. The previous social logic – such as the idea that colleagues have to take on extra work when someone is absent – was supplemented by, and in some cases supplanted by, an economic logic.
This effect was particularly evident among the most recently recruited trainees. They had not yet developed, over a prolonged period, a clear understanding of what attendance meant within the organisation. The bonus provided them with a new interpretation at an early stage: attendance is something for which there is a reward. It is therefore particularly interesting that absenteeism did not simply return to its previous level following the abolition of the bonus. The performance indicator – or rather, the incentive scheme linked to it – had disappeared, but the norm it had established had not completely vanished.
Here, the case touches on a fundamental problem with management by indicators. Goodhart’s Law, as famously put by Marilyn Strathern, states: ‘As soon as a measure becomes a target, it ceases to be a measure.’ [3] In the case of the attendance bonus, something even more significant happens. The metric does not merely lose its informative value; it alters behaviour and the significance of what it is actually intended to measure. This shifts the central question. It is no longer simply a matter of whether a metric measures correctly, it is a matter of what it triggers.
What matters is not the key figure alone, but the way it is constructed
To better understand this effect, it is helpful to draw on a distinction first proposed by Paul Adler and Bryan Borys: control can be designed to be either hindering or supportive. [4]
Inhibiting control measures from the outside, links results to consequences and gives those being measured little influence over how the measurement is derived or interpreted. Deviations quickly become a problem or even a cause for suspicion. The metric then serves primarily to monitor behaviour.
Supportive control works differently. It provides information that helps those who work with it. A key performance indicator can, for example, highlight where a process is stalling, where capacity is lacking or where problems are recurring. The measurement thus becomes a tool that supports people in their work.
A second dimension concerns the question of how responsibility and risk are distributed. Trust can remain passive, with an organisation merely taking it for granted. Or it can be actively shaped, with the organisation itself making commitments, creating the necessary conditions and binding itself to verifiable terms.
These two dimensions give rise to four different forms of control.
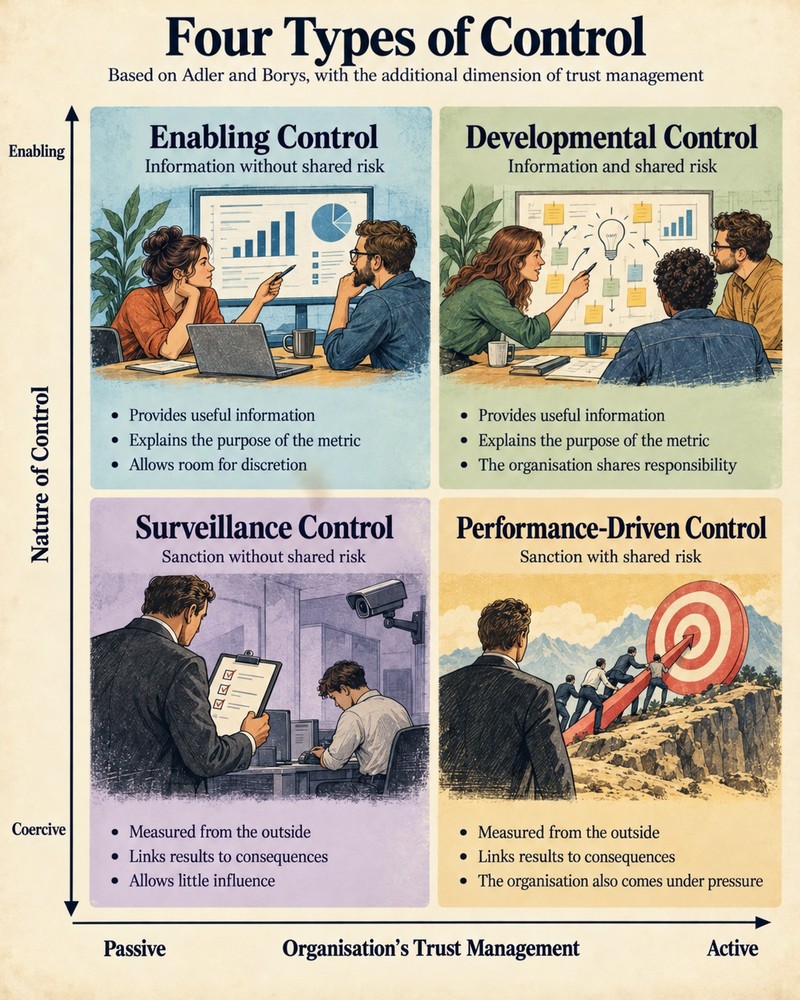
Figure: Four types of control
The situation becomes particularly problematic where restrictive monitoring clashes with a passive understanding of trust. This is precisely where the attendance bonus fits in: only the trainees were assessed, and the risk of non-compliance lay with them. The organisation itself was not required to disclose its own criteria, nor was it held accountable for the consequences of the key performance indicator.
The opposite approach is a constructive form of control, in which key performance indicators provide useful information to those affected whilst the organisation itself assumes responsibility. This distinction gives rise to a surprisingly simple test question for key performance indicators: Who bears the risk if the target is not met?
In the case of the attendance bonus, the answer was clear. The organisation risked little; it was the trainees who were assessed. The second variant of the experiment is also interesting: when attendance was rewarded with free time rather than money, the same negative effect did not occur. However, this did not improve attendance either.
This brings us close to other working environments. After all, exactly the same question can be applied to key performance indicators that companies use on a daily basis to manage their work.
What key figures can trigger in software development
Software development is heavily influenced by key figures. Teams measure velocity, lead times, error rates, response times, availability and many other metrics. At first glance, there is nothing wrong with this. On the contrary: good key figures can help us to better understand complex systems. However, the crucial question is whether a metric continues to serve as a tool or eventually becomes an end in itself. It is precisely at this point that behaviour and meaning often change.
Let’s take velocity. Within a team, it can help to estimate how much work can realistically be completed in a sprint. In this context, the metric provides guidance. However, if the same velocity is used to set targets or compare different teams, its function changes. Story points are then no longer merely estimates, but take on the character of a currency. And as soon as a metric becomes a currency, it is worth optimising it.
The situation is similar with ticket SLAs. A response time of four hours is easily measurable and therefore appealing. Whether a problem has actually been resolved or whether the person affected is satisfied with the solution is more difficult to translate into a figure. As a result, the measurable response time can become more important than the actual outcome. Approaches such as Experience Level Agreements attempt to correct precisely this shift by focusing more strongly on the experienced outcome.
Deployment Frequency, Lead Time and Change Failure Rate are not automatically good or bad metrics either. The DORA metrics were developed to help teams better understand their own delivery process. Problems arise when the same metrics are used to compare or evaluate teams. This shifts the focus from the process to the people operating it. DORA therefore expressly warns against using such metrics as individual performance indicators or as a simple ranking system between teams. [5]
The same principle applies to availability metrics. A target of 99.9 per cent availability initially sounds like a clear statement of quality. However, the metric becomes more interesting when a second question is asked: what happens if the target is not met? If the operations team bears the responsibility, whilst decisions regarding architecture, budget or staffing are made elsewhere, the risk once again falls solely on those being measured.
The examples differ, but they all follow the same pattern: a key figure becomes problematic when it no longer serves primarily to better understand work, but rather to enforce behaviour without simultaneously taking into account the conditions under which that behaviour is supposed to arise.
An example from a completely different industry illustrates just how far this dynamic can go.
When sales targets become the end in themselves
Wells Fargo managed its sales through ambitious cross-selling targets. Staff were expected to sell as many banking products as possible to each customer. Under the resulting sales pressure, accounts and other products were opened over a period of years that customers had not requested. [6]
What is particularly revealing here is not only the misconduct itself, but the structure behind it. The organisation had set metrics and targets, whilst employees bore the immediate pressure to meet these targets. Thousands of staff were dismissed in connection with breaches of sales rules. The underlying target systems, however, only came under significant pressure much later.
This case is far more extreme than a misapplied ‘velocity’ metric or an ill-conceived attendance bonus. The logic behind it, however, is comparable: as soon as a key performance indicator becomes the dominant target, people begin to base their decisions on that figure. This is precisely why it is worth asking about the risk. It shifts the focus away from the number and towards the system within which the number operates.
Why AI enables even more key figures
This question is becoming even more important because organisations can now collect significantly more data than they could just a few years ago. Until now, the effort involved has been a natural limitation. Data had to be collected, consolidated, analysed and interpreted. This friction is rapidly diminishing. A dashboard that brings together commit frequency, review times, tool usage and ticket throughput per person can now be set up with significantly less effort. AI can also structure data, identify correlations and automatically generate new analyses.
However, this not only increases the potential to develop meaningful metrics; it also increases the temptation to measure everything that can technically be measured.
This is precisely where the real challenge lies. The mere availability of a key figure does not answer the question of whether it is meaningful. Technical feasibility says nothing about whether a measurement supports collaboration, fosters trust or changes behaviour in an undesirable direction. The easier it becomes to measure, the more important it therefore becomes to be able to consciously do without certain key figures. [7]
Four questions for every key figure
If you want to review existing key figures, you don’t need a complicated process. A good place to start is the question already mentioned:
Who bears the risk if the key figure is not achieved?
If this risk lies solely with those being assessed, whilst the organisation itself does not question its own assumptions or decisions, it is worth taking a closer look.
Three further questions complete the test:
- Do those being assessed know the purpose of the key figure and do they consider it meaningful?
- Can they change the key figure or the method if it is measuring the wrong thing?
- What behaviour does the metric make seem reasonable or attractive?
The last question in particular often changes the way we view metrics, because people do not need to manipulate them to cause undesirable consequences. It is enough for them to adapt their behaviour sensibly to the conditions that an organisation has created.
Those who are rewarded for high velocity pay greater attention to velocity. Those who are assessed on short response times react more quickly. Those held accountable for the number of products sold try to sell more products. At first glance, this is not a malfunction. It is an expected reaction to a control system. It becomes problematic when the metric overshadows the actual objective.
Good key figures help us understand
The instinct to use key performance indicators to make problems manageable is understandable. Figures enable comparison, reduce complexity and convey the impression of objective controllability. This is precisely why key figures are among the most important tools of modern organisations. But a key figure does not observe a social system from the outside. As soon as people know that they are being assessed, rewarded or penalised on the basis of it, it itself becomes part of that system.
The attendance bonus illustrates this particularly clearly. The key figure did not simply measure inaccurately. The management system linked to it changed what attendance meant for those affected. That is why, when it comes to key figures, the question ‘Are we measuring correctly?’ is not enough.
At least as important is the question: What becomes the sensible course of action for people as soon as this key figure counts?
And immediately after that: Who bears the risk if it is not achieved?
Good metrics provide insights into the work; bad ones mainly give people a reason to focus on the figure itself. Perhaps that is precisely the simplest test for determining which metrics an organisation really needs.
Notes:
Guido Bosbach supports organisations on their journey towards clarity in dealing with AI. He would be happy to discuss with you how to clarify AI accountability within your company. Simply contact him via his website or message him on LinkedIn.
Also highly recommended is his workLIFE Stories blog, in which he regularly shares experiences from the business world, ideas and insights.
[1] Hossain, T., List, J. A., Rasul, I., Sliwka, D. & Vogelsang, T.: When Bonuses Backfire: Evidence from the Workplace. Management Science, 2023.
[2] University of St Gallen: Prof. Dr Antoinette Weibel, profile and brief CV from the Research Institute for Work and Working Environments.
[3] Strathern, M.: ‘Improving ratings’: audit in the British university system. European Review, 5(3), 305–321, 1997.
[4] Adler, P. S. & Borys, B.: Two Types of Bureaucracy: Enabling and Coercive. Administrative Science Quarterly, 1996.
[5] DORA: Software Delivery Performance Metrics and Accelerate State of DevOps Report 2024.
[6] U.S. Department of Justice: Wells Fargo Agrees to Pay $3 Billion to Resolve Criminal and Civil Investigations into Sales Practices Involving the Opening of Millions of Accounts without Customer Authorisation, 2020.
[7] Technically possible, but questionable in content
Here you can find further information on Velocity, Experience Level Agreements and DORA metrics.
Would you like to support Guido Bosbach and discuss clarity in the use of key figures? Then share this post on social media or within your organisation.
Guido Bosbach has published three more posts on the t2informatik Blog:

The hidden role of expert decisions in code

Ethics is not a role that can be assigned

AI needs clarity

Guido Bosbach
Guido Bosbach advises management boards and leadership teams on how to gain clarity regarding responsibility, decision-making processes and values within their organisations – before these issues escalate into unresolved conflicts. He supports companies from the initial assessment right through to the establishment of a regular review process, currently with a particular focus on how organisations can clarify responsibility for AI decisions without permanently outsourcing them.
On the t2informatik Blog, we share knowledge and experience with people in organisations. We have been developing and modernising software for them since 2012. Pragmatically. ✔️ Personal. ✔️ Professional. ✔️ Get to know t2informatik as your development partner.