
What are DORA metrics?
Table of Contents: Definition – Overview – Informativeness – Improvement – Anti-patterns – Questions from the field – Notes
DORA metrics: delivering software quickly and reliably
A development team regularly releases new features. Some changes reach production within a few hours, whilst others take several days. Occasionally, a deployment results in an error that is quickly resolved; sometimes, recovery takes considerably longer. But how well does software delivery actually work? And how can we tell if it is improving over time?
This is precisely where DORA metrics come in. DORA stands for DevOps Research and Assessment and examines the capabilities and working practices that characterise successful software teams. This has resulted in key performance indicators that can be used to measure important aspects of software deployment.
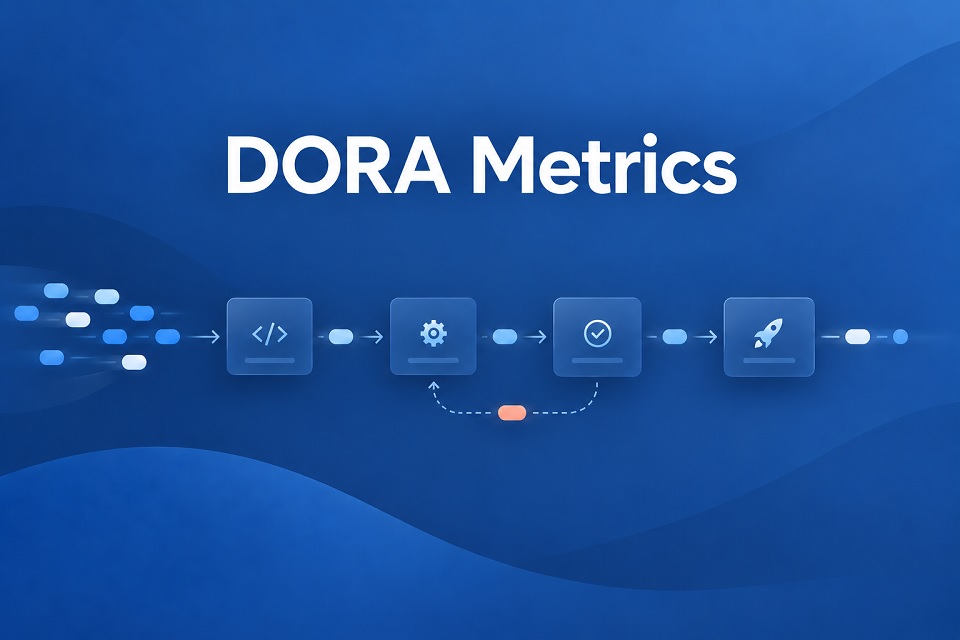
The DORA metrics primarily focus on two questions: How quickly do changes make it into production? And how stable and reliable is this process?
They help teams to identify bottlenecks and areas for improvement, monitor developments over a longer period and assess the impact of improvements. The aim is not to compare individual developers or teams with one another, but to gain a better understanding of their own development and deployment process and to improve it in a targeted manner.
An overview of the DORA metrics
For a long time, four DORA metrics were the most widely recognised; these were often referred to as the ‘Four Keys’. DORA has further developed this model over the years. Today, it comprises five metrics that examine two areas: the throughput and the instability of software delivery. [1]
Three metrics describe throughput – that is, how quickly changes make their way into production. Two more metrics examine instability and show how often problems arise or unplanned rework becomes necessary.
| Area | DORA metric | What is being measured? |
| Throughput | Change Lead Time | How long does it take from committing a change to successful deployment in production? |
| Throughput | Deployment Frequency | How often are changes deployed to production? |
| Throughput | Failed Deployment Recovery Time | How long does it take to restore normal operations following a failed deployment? |
| Instability | Change Fail Rate | What proportion of changes causes problems and requires immediate correction? |
| Instability | Deployment Rework Rate | What proportion of deployments are unplanned and serve to resolve issues in production? |
The individual metrics examine different aspects of software delivery. Together, they show how quickly a team can deliver changes and how reliably this process works.
What do the DORA metrics tell us and how are they measured?
The DORA metrics examine two aspects of software delivery: speed and stability. Change Lead Time and Deployment Frequency show how quickly and frequently changes reach production. Change Fail Rate, Deployment Rework Rate and Failed Deployment Recovery Time reveal how reliably this is achieved and how a team deals with problems.
The interplay between the metrics is crucial. A single value may provide some indication, but says little about the quality of the entire deployment process. Only when several values are considered together is it possible to gain a better understanding:
| Observation | Possible conclusion |
| Short change lead time and high deployment frequency | Changes can be deployed quickly and regularly. |
| High deployment frequency and high change failure rate | The team deploys frequently, but the changes lead to problems relatively often. |
| Long change lead time and low change failure rate | Although changes are stable, they may take an unnecessarily long time to reach production. |
| Low change failure rate and short recovery time | Problems occur rarely and can also be resolved quickly. |
| High deployment rework rate | A significant proportion of deployments are unplanned, resulting from errors and necessary rework. |
| Improved speed whilst maintaining or increasing stability | The deployment process is developing positively overall. |
DORA metrics are measured using events that occur naturally during the development and deployment process. These include, for example, commits, deployments, failed changes and their resolution. Data sources may include version control systems, CI/CD systems, and systems for monitoring and incident management.
It is not a single metric value that is particularly valuable, but rather how it changes over time. Teams can, for example, check whether changes reach production more quickly following an improvement, without this leading to more errors. DORA metrics therefore serve less as a score and more as a tool for identifying trends and specifically improving one’s own deployment process.
From measurement to improvement
DORA metrics only realise their full potential when measured values lead to concrete improvements. It is therefore not enough simply to record key figures regularly and display them on a dashboard. What matters is the questions a team derives from them.
A sensible process might look like this:
Determine the baseline situation
First, the current values are examined over a sufficiently long period. Individual outliers are less important than recurring patterns and discernible trends.
Identify anomalies
Which metric is changing significantly? Where are long waiting times occurring? Where is the number of failed changes rising? It is important not to jump to conclusions about the cause.
Investigate causes
A long change lead time, for example, can be caused by large work packages, lengthy code reviews, manual approvals or unstable tests. The metric highlights the problem area, not necessarily the cause.
Try out a targeted improvement
Rather than changing many things at once, it is usually more helpful to implement a specific measure. This could, for example, involve automating an approval step, making smaller changes or establishing a more stable test pipeline.
Assess the impact
The next step is to monitor whether the expected metric improves and whether other values remain stable. If, for example, the change lead time is reduced without the change failure rate increasing, this indicates a positive change.
In this way, DORA metrics become a tool for continuous improvement. They do not help teams to produce the best possible figures, but rather to test hypotheses and improve their own software deployment process step by step.
It is particularly important to look at the system as a whole. A measure is not considered successful simply because a single metric has improved. Only when speed, stability and the necessary rework are considered together can it be assessed whether the process has actually improved.
Anti-patterns and common mistakes
DORA metrics can be very helpful. However, if used incorrectly, they can quickly create the wrong incentives or lead to misleading conclusions:
Using DORA metrics for performance assessment
These metrics are not suitable for evaluating individual developers or teams. If metrics are linked to personal targets, bonuses or rankings, this quickly creates an incentive to optimise the number rather than the process.
A high deployment frequency, for example, can be increased by deploying very small changes that are of little technical relevance more frequently. The metric improves without this automatically creating more value.
Comparing teams based on their metrics
Comparisons between teams may seem appealing, but are often of little significance. Different products, technical platforms, risks or regulatory requirements have a strong influence on the metrics. It makes more sense to compare a team or a service with its own past performance. This reveals whether changes have actually led to an improvement.
Optimising individual metrics in isolation
Improving just one metric can create new problems elsewhere. A shorter change lead time, for example, is not a success if the change fail rate rises significantly at the same time.
Metrics should therefore always be considered together. What matters is not the best value for a single metric, but a balanced combination of speed, stability and as little unplanned rework as possible.
Turning benchmarks into rigid targets
Benchmarks can provide guidance, but should not automatically become binding targets. A value that makes sense for another team may not be suitable for your own product or system. This becomes particularly problematic when the sole focus is on achieving a target value. In such cases, there is an increased risk that metrics will be optimised without the software delivery process actually improving.
Reacting too quickly to individual readings
A single poor reading may be the result of an outlier. A difficult release, a major incident or an unusual change can cause a metric to deteriorate significantly in the short term. Recurring patterns and trends over a longer period are more meaningful. Teams should therefore analyse trends rather than treating every short-term fluctuation as an immediate problem.
Collecting metrics without drawing any conclusions
A dashboard on its own does not improve a process. If metrics are recorded regularly but neither discussed nor linked to specific actions, this primarily results in additional reporting effort.
DORA metrics are particularly valuable when they prompt questions, support hypotheses and make changes verifiable. Their purpose is not reporting, but improving the software delivery process.
Questions from the field
Here you will find some questions and answers from practice:
Does a high deployment frequency automatically mean that a team is performing well?
A high deployment frequency is not proof of good work, as it merely indicates how often changes can be deployed to production. It does not indicate whether these changes are useful to users, nor whether the right features are being developed.
A team can deploy several times a day and still fail to meet its users’ needs. Conversely, a team can develop valuable software even if its technical deployment process is unnecessarily slow. DORA metrics therefore primarily measure the efficiency of software deployment, not the commercial success of a product. To get a more complete picture, they should be combined with, for example, product, usage or reliability metrics.
Can a low change fail rate be misleading?
A low change fail rate can be misleading if viewed without the context of other metrics. Suppose Team A carries out 100 small deployments, five of which cause problems. Team B releases only four major changes, none of which fail. Team B’s change failure rate looks better. However, this does not automatically mean that Team B has the better deployment process.
Rare and large changes can carry a higher risk, even though this risk is not immediately apparent in the change failure rate. Furthermore, the metric says nothing about how serious a fault is. A minor display error and an outage lasting several hours can both count as failed changes.
The change failure rate should therefore not be equated with the reliability of a system. For this, additional information such as downtime, service level objectives or the impact on users is important.
Why can speed and stability both improve at the same time?
Speed and stability can both improve at the same time because frequent, small changes are often easier to manage than infrequent, major releases. Small changes are easier to test, verify and roll back if problems arise. At the same time, teams receive feedback more quickly and can identify errors at an earlier stage. Frequent releases can therefore actually help to reduce the risk associated with individual changes.
The aim is therefore not ‘speed over stability’, but to create a deployment process that enables both.
What does it mean when DORA metrics show differing trends?
Differing trends in DORA metrics are particularly revealing because they may indicate potential conflicts of interest or weaknesses. If all metrics improve at the same time, the interpretation is relatively straightforward. If they move in different directions, it is worth taking a closer look.
For example, a shorter change lead time accompanied by a rising change fail rate could mean that changes are being deployed more quickly, but that important checks are being neglected in the process. Conversely, a low change fail rate combined with a very long change lead time could indicate lengthy approval processes, queues or time-consuming testing procedures.
Such combinations do not yet identify a cause, but they do show where it is worth looking into further. This is precisely where one of the great benefits of the DORA metrics lies.
Why shouldn’t we simply average DORA metrics across the whole organisation?
It is not a good idea to average DORA metrics, as averages can mask important differences. A modern web application with multiple deployments per day has different requirements to a legacy system that is only updated a few times a year.
If you combine both values into a single company-wide metric, you may end up with a precise figure, but little useful information. A high-performing service can mathematically offset the problems of another service. It is therefore worth examining the metrics at the level of an individual application or service. Comparisons are particularly helpful when the context and technical conditions are similar.
What are good DORA metrics?
Good DORA metrics cannot meaningfully be reduced to a single, universally applicable figure. Benchmarks can show how your own metrics compare with those of other teams or applications. However, they should not automatically become target figures.
A benchmark tends to answer the question ‘Where are we roughly?’ rather than ‘What should we improve next?’. If, for example, ‘deploying several times a day’ is declared a binding target, the metric can be optimised without yielding any benefit.
It is more helpful to use your own figures as a starting point: where do changes cause a significant loss of time? Where does unexpected rework arise? Which improvements do we want to try out, and do they change the relevant metrics? In this way, DORA metrics shift from being a performance comparison to a tool for continuous improvement.
Can DORA metrics identify the root cause of a problem?
DORA metrics do not usually identify the root cause of a problem, but rather highlight its effects. For example, they can show that changes take a long time or frequently lead to problems. However, they do not automatically explain why this happens.
A long change lead time can have many causes: lengthy code reviews, unstable tests, manual approvals, a lack of test environments, large work packages or dependencies on other teams. The real work therefore often only begins after the measurement has been taken. Teams can examine the affected process in more detail and then check whether a change improves the DORA metrics. The metrics thus function more like warning lights than as a fault diagnosis.
Why is Failed Deployment Recovery Time now included in throughput?
Failed Deployment Recovery Time is now included in throughput because it measures how quickly a team can restore a system to a working state following a failed deployment. Recovery is therefore also part of the ability to move changes effectively through the deployment process. [2]
Previously, this metric was more commonly categorised under stability. This is why older representations of the DORA metrics often still use a different classification. The fact that DORA subsequently changed this categorisation demonstrates that the model has not remained static, but has been further developed on the basis of new research and insights.
The current DORA model distinguishes between Software Delivery Throughput and Software Delivery Instability. Throughput comprises Change Lead Time, Deployment Frequency and Failed Deployment Recovery Time. Instability is described by the Change Fail Rate and the Deployment Rework Rate.
The logic behind this is interesting: the Change Fail Rate answers the question of how often things go wrong. The Failed Deployment Recovery Time, on the other hand, answers the question of how quickly the team can respond to such issues. An error therefore describes instability, whilst the speed at which it is rectified reflects a capability of the delivery process.
What is more important for good software: delivering it as quickly as possible, or causing as few errors as possible?
Notes:
If you like this post or would like to discuss it, please feel free to share it within your network or in your organisation.
[1] An overview of the development of the DORA metrics, from the classic four metrics to today’s model with five metrics
[2] Classification of the five DORA metrics
Here you will find scientific fundamentals, research models and studies by DORA research.
We also recommend the following two articles: Hunting for key figures and When collaboration becomes more than the sum of its parts.

Challenges in the use of metrics
Factors for success in release management

What is Developer Velocity?
‘Smartpedia’ is our glossary for people in organisations involved in software development, project management and product management. It is for precisely these people and their organisations that we have been developing and modernising software since 2012. Pragmatic. ✔️ Personal. ✔️ Professional. ✔️
Get to know t2informatik from Berlin as your development partner.