Using data science in retrospectives
Table of Contents
Tidying up the backlog – supported by data analysis
Cross-functionality and head monopolies – detectable through data science
Are we focused on a sprint goal and does our velocity fit?
Does the typical workflow correspond to the planned workflow in our project?
Technical background to the Jira data dump and data preparation
Conclusion
Every team is different. Regardless of agile approaches like Scrum or Kanban or approaches from classic project management – all projects have one thing in common: No project is perfect or without obstacles. And while the team tries to remove obstacles so that it can work in a focused way, individual issues arise depending on the team:
- In our backlog, more and more chaos has arisen from smaller issues – why is that? Are there perhaps commonalities or dependencies that we don’t see (anymore)?
- Is our team cross-functional? Are there head monopolies and does our skillset match the evolving needs?
- How accurately do we estimate effort and team performance? What are the influencing factors that make it difficult for us to estimate?
- …
In the meantime, there are numerous possibilities to find data-driven answers to such and similar questions. The Scrum Guide also refers to empiricism as the basis for the three Scrum pillars of transparency, review and adaptation. Empiricism is also indispensable for the product planning of Product Owners and for the coaching work of Scrum Masters.1
This article refers to Scrum as one of the most widespread frameworks, but data science methods can be used in any agile approach. A lot of relevant data is stored in ticket systems – often Jira, which is why we use this system as a basis.
In practice, Scrum Masters, Product Owners and Project Managers quickly end up with one foot in the data science domain when they try to analyse these questions using the Jira Query Language (JQL) or Jira’s own reports. But what if Jira’s analytics reach their limits because the team’s questions are too individual? If other data sources need to be integrated into the analyses or data needs to be cleansed, interactive ad-hoc analyses or more advanced AI analyses (such as process mining) are required, the answers to supposedly simple questions quickly become complex.
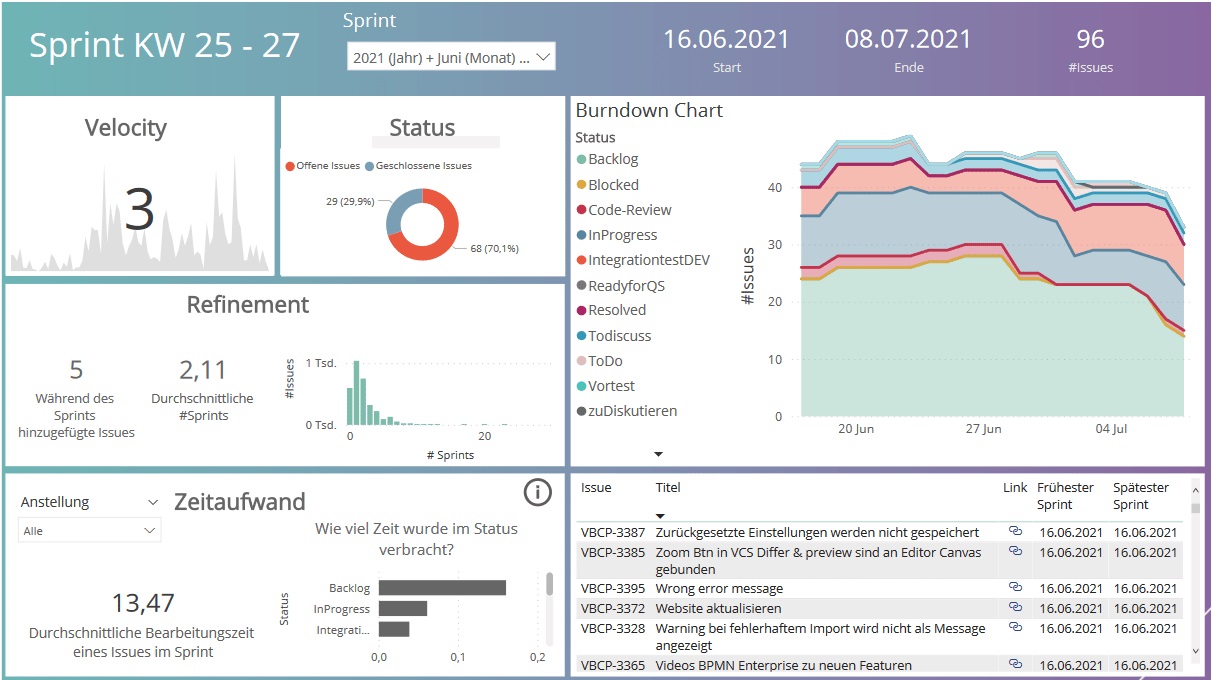
It is possible – and often the first approach – to export data (so-called issues) from the ticket systems to Excel, for example, and to analyse them there in order to answer our questions. However, here you will quickly and inevitably come up against the 1,000-issue limit of the Jira data export. Experience has also shown that the analysis possibilities of Excel are quickly exhausted. In such cases, individual, customisable and transparent visualisation options are needed that offer both general analyses that would also be possible in Jira and further analyses. One result could be, for example, the following overview page, a so-called dashboard:
Figure 1: Interactive dashboard that answers various questions using data science methods
- Dashboards can be adapted to any type of Jira project (Scrum, Kanban or classic project).
- Experience has shown that a Jira project with a runtime of a few months is already sufficient as a data basis for this.
- It is suitable for all project sizes, from single projects to large “scaled agile” multi-projects or project programmes.
- The method can be adapted to individual questions and combined with other data sources.
In the following, we present some use cases that can be answered with data science methods and a dashboard. Finally, we briefly present the technical procedure for Jira data extraction and the methods used – but the focus is on the possible solutions.
Tidying up the backlog – supported by data analysis
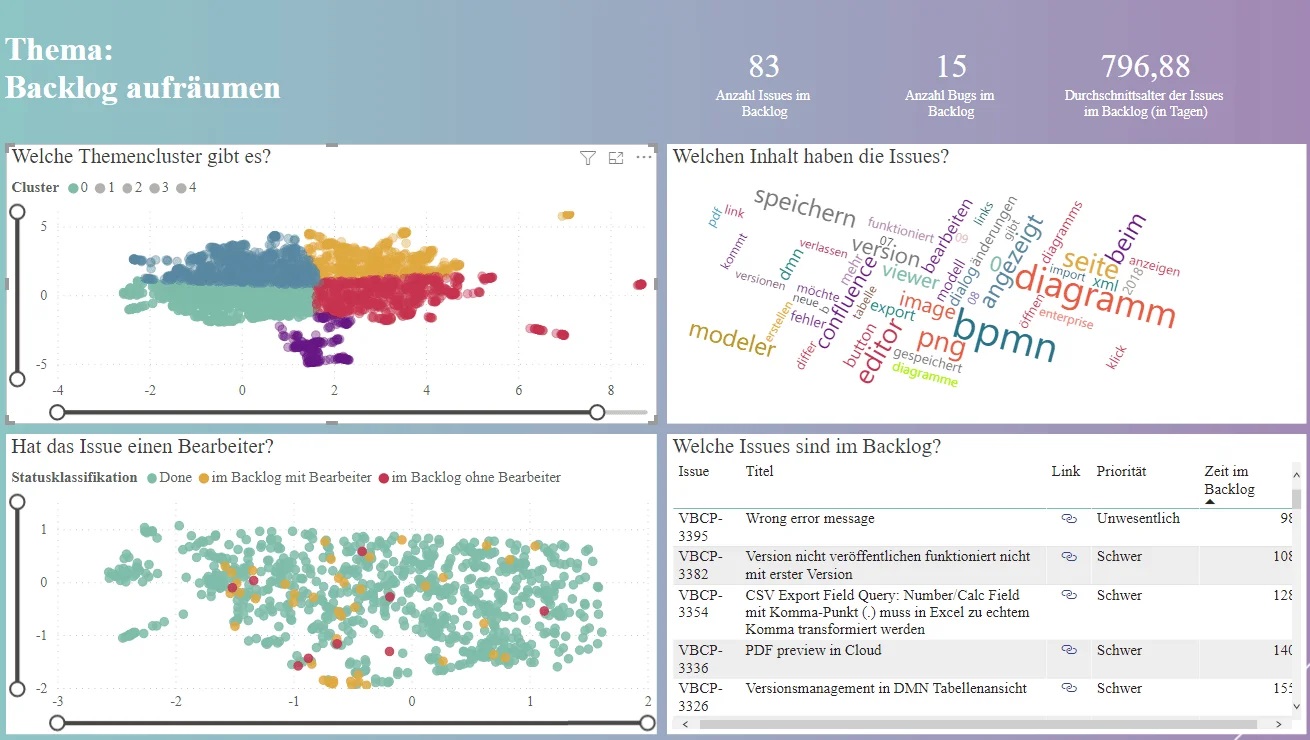
Requirements, desired features or ideas for extensions are collected in a backlog. It often grows immensely over time. Between important requirements are obsolete requirements, duplicates or features that have long been implemented. This makes prioritisation difficult and destroys the overview for relevant issues. It is therefore essential to tidy up the backlog from time to time. Interactive dashboards provide considerable support here by showing ways in which the backlog can be sorted out and systematically processed.
Figure 2: Interactive dashboard with various information on the backlog
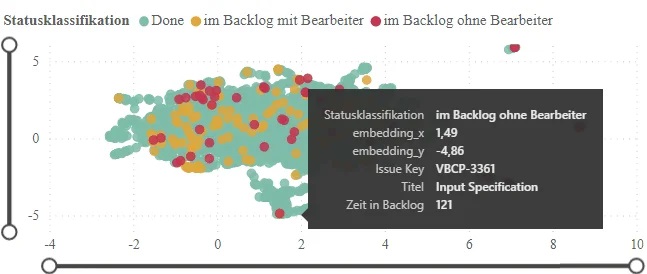
The issues can also be coloured according to different criteria and displayed in an interactive visualisation so that users can hover over the points/issues to take a closer look at individual issues and compare them with similar issues.
Figure 3: Issues in a 2D landscape with colouring according to status – in the picture the mouse is hovered over an issue so that details about the issue are popped up
- Which issues are similar or duplicated and should be merged?
- Which issues are outdated or have already been dealt with in other work?
- Which issues do not have an editor and who could be a useful editor?
- Which issues are too large and need to be cut?
- Is there a group of issues with similar content that could be used together in a sprint?
In the diagram, the completed issues are visualised in addition to the backlog in order to depict the overall context of the product. Issues in the status ‘Done’ are coloured green, in the status ‘Backlog’ with editor:in yellow and in the status ‘Backlog’ without editor:in red. The red and yellow dots in the graphic are relevant for identifying similar or duplicate backlog contents, because these have not yet been processed. If you compare these with the nearby data points, issues with similar content appear. Then it can be decided whether a merger or setting a dependency to other already existing content makes sense. To identify obsolete content, you can compare open requirements in the backlog with similar issues in the status ‘Done’ and check whether requirements have already been implemented in parts here.
The graphic offers even more analysis potential. A large part of the requirements has already been implemented – can something be learned from these completed issues for the open requirements? It makes sense to consult the people who have worked on completed issues for similar future refinements. It may be possible to use synergy effects in the processing, and it may be possible to identify head monopolies that need to be taken into account when processing the tickets in the backlog.
Cross-functionality and head monopolies – detectable through data science
Head monopolies and a lack of cross-functionality in the team represent considerable risks or even bottlenecks for a project. Knowledge about the project is at risk of being lost if the owner of the head monopoly drops out or leaves the project. The method used in the previous section and the 2D issue landscape can be used by the team to reflect such head monopolies.
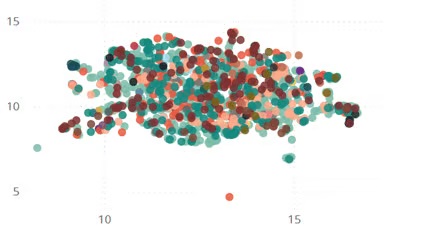
Issues with similar content are again next to each other. Now issues are coloured according to the agent:in. Issues with the same editor have the same colour and, taking into account fairness and data protection, the following questions can be answered:
- Is the team cross-functional or are there head monopolies in individual areas?
- Are there external agents who are not part of the Scrum team?
If areas of the graphic (Figure 4) are coloured in the same colour, this indicates a head monopoly. If the graphic is coloured in, the team acts cross-functionally. It is also easy to see which issues have been implemented by people outside the team. Is there a need for training here so that the members of the Scrum team can work on similar issues independently in the future?
With the help of this diagram, you can quickly recognise which member of the Scrum team is closest to this issue and consider whether it makes sense to support this colleague with additional training.
Figure 4: Issues are coloured according to their editor. You do not see any larger clusters: everyone can contribute thematically everywhere.
Are we focused on a sprint goal and does our velocity fit?
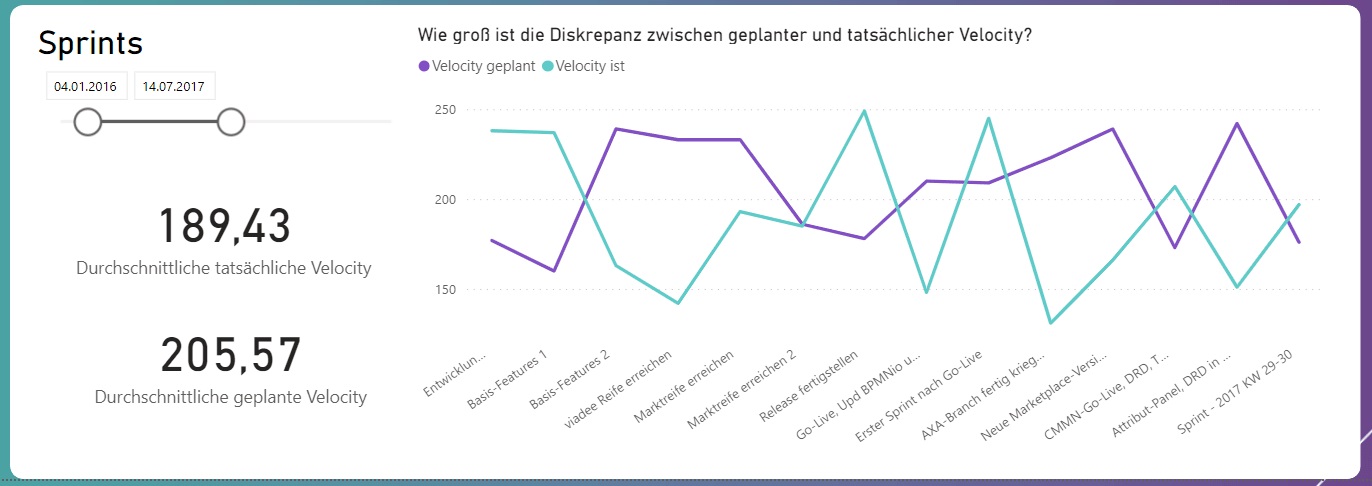
Scrum teams develop a sense over time of how many tasks they can complete per sprint. Story points are often used to estimate content. The total number of story points completed is then called velocity and can be used to plan future sprints. If you as a team notice that issues are often not finished at the end of a sprint, it could be that the Scrum Team is misjudging itself. Is there a discrepancy between planned and actually implemented velocity? This question can be easily visualised in a dashboard.
Figure 5: Time course of the discrepancy between planned and actually implemented velocity
- How come the velocity in our project fluctuates so much?
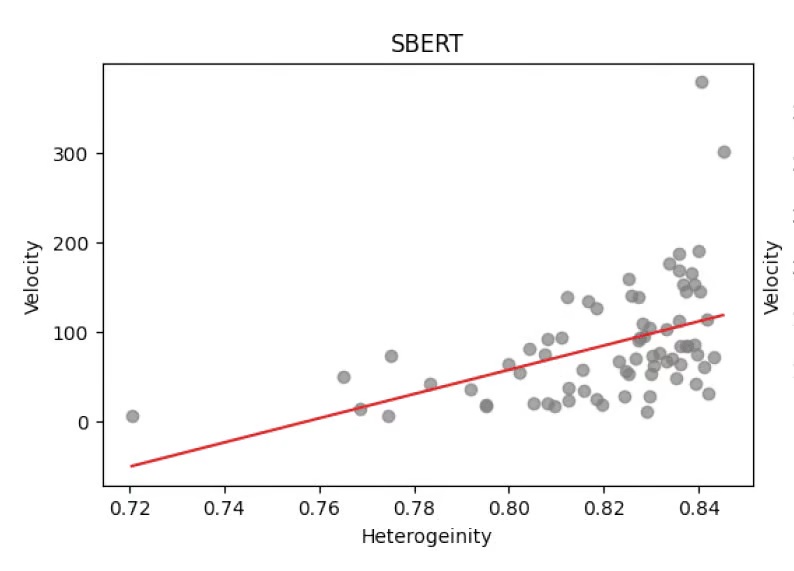
We had the hypothesis that fluctuations can be explained by sprint content: The more similar the issues in a sprint are, the more efficient the sprint becomes due to synergy effects. This hypothesis can also be examined with an AI method.
First, the heterogeneity of a sprint is determined with the method SBERT (Sentence Bidirectional Encode Representations from Transformer). This method is also used when websites display similar articles to an article: “The following article might also interest you”. The method embeds sentences in a multi-dimensional space so that semantically similar sentences are close to each other. In this way, the text from the title and description of an issue can also be placed as text in the multi-dimensional space. Points that are close to each other correspond to issues that are semantically similar. Then a heterogeneity score can be determined for each sprint and correlated with the velocity of the sprint.
Figure 6: Scatter plot shows correlation between heterogeneity and velocity: the more diverse the tickets in the sprint, the higher the velocity.
In the team analysed here, the sprint with the highest velocity was also a sprint with high heterogeneity. Statistically, it could also be shown that the more heterogeneous a sprint was, the higher the velocity of the sprint tended to be. One reason could be that the parallel processing of different user stories reduces the coordination effort of the developers, since they do not have to coordinate with other developers during the processing or wait for the implemented features of the others. In such a case, we speak of single developer velocity – but this increases the risk of a knowledge monopoly.
Does the typical workflow correspond to the planned workflow in our project?
What are the weaknesses in our process flow? Are there bottlenecks or do issuess often jump back and forth between statuses?
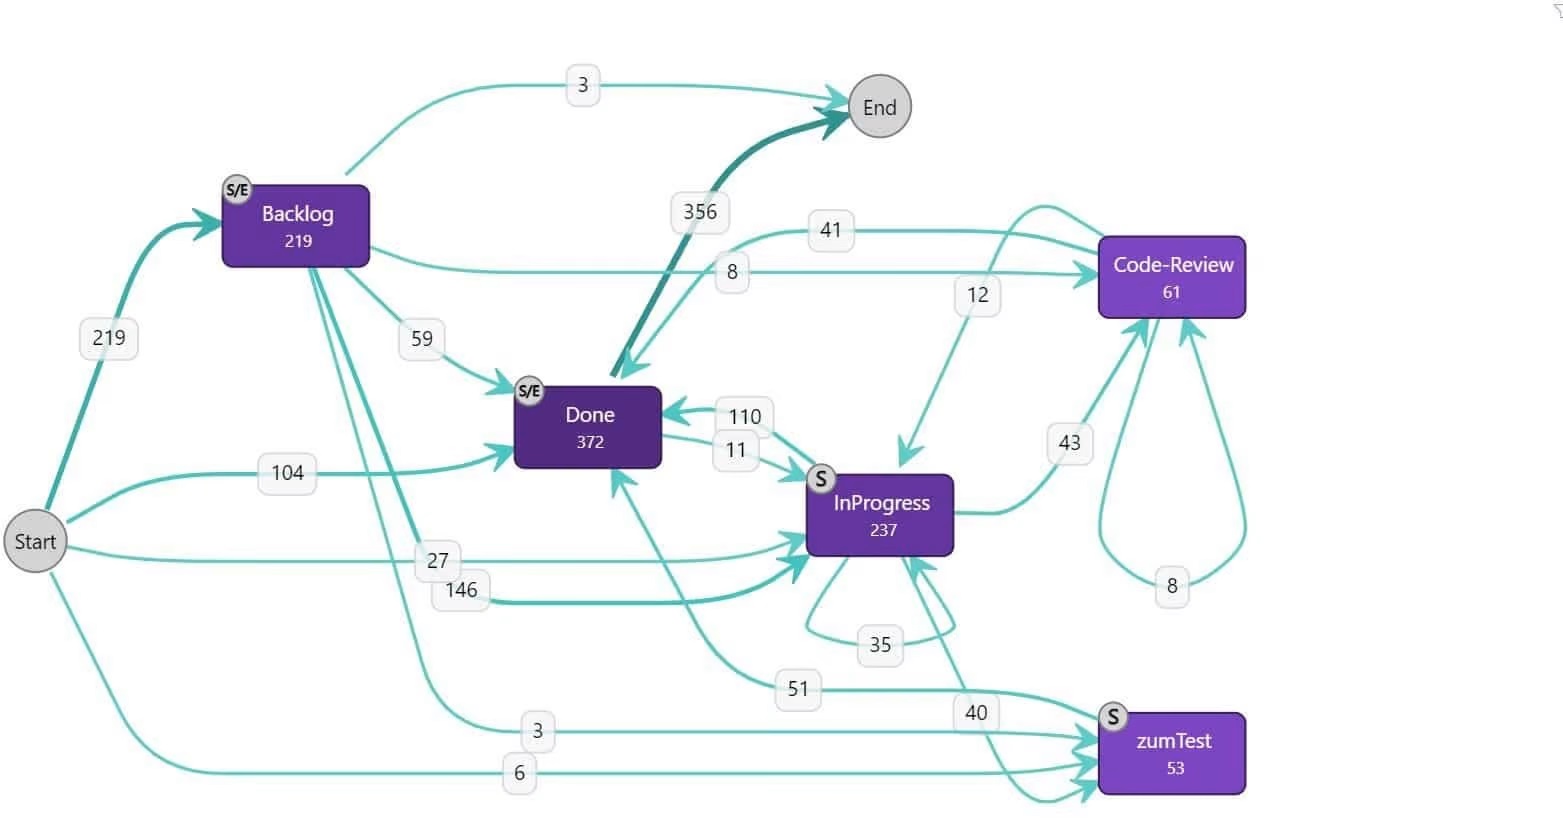
These questions can be asked within a team to recognise anomalies and optimisation potential in the process. Jira data offers the possibility to trace the change history of the implemented tasks and to use this “event log” as a basis for process mining. In addition to the process flow in the form of status changes, other changes such as comments or agent changes can also be included as events. The resulting graph has all status changes as nodes. The number of issues on the one hand and the process step duration on the other hand can be used as edge weighting.
The following questions can be answered based on the analysis:
- Which path do the issues often take? Does this correspond to the process we defined in Jira?
- Which unusual processes occur regularly? Why does this workflow occur?
- What are the unusual process flows? Are closed issues frequently reopened?
- Do process steps take a conspicuously long time?
Can you explain why issues in your project frequently undergo these status changes?
Figure 7: Frequent status transitions in a project shown in a graph: In this graph, issues frequently jump from “done” back to “in progress”. Perhaps the definition of done in this project is not precise enough, so that too many errors are found after testing?
Technical background to the Jira data dump and data preparation
The application scenarios described above make the treasure trove of data managed in Jira clear. How can you extract this data and realise analyses?
Many complex analyses cannot be implemented using the reports and JQL expressions provided by Jira. For this, the Jira API3 for exporting issues data is a good choice. This is authorised by a token with the same rights that the user has in the Jira frontend. In this way, only issues and information can be extracted that can also be accessed on the Jira interface.
To apply this data extraction and preparation quickly and easily to different projects and application scenarios, we have developed Python scripts that automate this extraction step. The result format of the REST API is initially JSON data, which contains all issue information, sprint times and change histories. For further analysis, these are converted into a tabular data format, so that the result of the data preparation is csv files with the relevant information.
For some analyses, such as those that identify experts for a topic within a team, a reference to a person makes sense. However, in the majority of analyses, person-independent patterns or information are considered. In terms of data protection, these should take place without reference to persons. For this purpose, personal data (editors, observers and links in text fields) are automatically pseudonymised during data preparation. In addition, a whitelisting approach can be used to integrate only ticket information without personal reference into the analyses. As soon as the data has been tabulated, further analyses can be realised. The created database enables the use of any tools.
The analyses presented require a further automated preparation step. In this step, the textual fields are first vectorised. Which fields are relevant is determined by the individual application and can be configured. As an NLP method, BERT4 – a pre-trained model developed by Google – is suitable because it vectorises the words and takes the contextual information of the sentence into account. To ensure that words with little meaning do not distort the result, stopwords (e.g., and, or) but also individual terms such as company names, which must be configured beforehand, are removed. The result is a vector representation that can be used for various analyses.
An interactive self-service dashboard such as PowerBI or tableau can be used to visualise and provide the analyses. In this way, the project team, Scrum Master, Product Owner or project manager can answer individual questions and choose the appropriate level of detail.
Figure 7: The path of data from Jira via the REST API into a dashboard.
Conclusion
Project teams collect an immense treasure trove of data in ticket systems like Jira, which can be used for their own internal reflection. It is becoming easier and easier for teams to access this data. The Jira data does not necessarily have to be exported manually, laboriously prepared and evaluated, but can provide answers to the respective, individual questions with the help of interactive and suitably prepared dashboards.
In the course of data analysis, it is important to consider separately and explicitly that evaluations are not misused as control instruments. It is also important to note that many of the graphics cannot be meaningfully interpreted without the contextual knowledge of the teams. Nevertheless, this method can be used to visualise project progress and certain issues in a meaningful way. On this basis, individual issues can be discussed in the team and possible needs for action can be derived. Possibly, the cooperation and communication with stakeholders can also benefit from the data analysis.
Notes:
Are you interested in setting up an automatic data export for the creation of a first dashboard (e.g. with PowerBI) and an evaluation by professional data scientists and agile coaches? Then Dr. Ina Humpert and Ronja Köhling would be happy if you invite them to a data-driven retrospective and start a conversation. Alternatively, you can also take a look at viadee’s extensive range of training courses on agile working.
[1] Schwaber, Ken and Sutherland, Jeff. Der Scrum Guide. (2020)
[2] UMAP
[3] Jira REST API
[4] Devlin, J., Chang, M.W., Lee, K., & Toutanova, K.. (2018). BERT: Pre-training of Deep Bidirectional Transformers for Language Understanding.
If you like the post or want to discuss it, feel free to share it with your network.
Dr. Ina Humpert and Ronja Roehling have published another article in the t2informatik Blog:

Dr. Ina Humpert
Dr. Ina Humpert is a mathematician and works as a consultant at viadee IT-Unternehmensberatung. Her focus is data engineering on SQL-based databases. For the past two years, she has been active in a reporting project in which a data warehouse is being further developed on the basis of which reports are created. She is also interested in agile topics and their interfaces to the field of data science. She is in active exchange on these topics with the organisational developers at viadee.

Ronja Koehling
Ronja Koehling is a consultant at viadee. Her current focus is on data science, including machine learning, operations research and process mining. She is responsible for training in the area of Power BI. She is currently supporting the development of an event data infrastructure with a cloud native approach to create the basis for process mining.
