Benefits of cloud reporting: Power BI and Snowflake
Due to advancing technologisation, ever larger amounts of data are being collected. In order to evaluate this data and create added value for the company, real-time analyses are often necessary. Here, a cloud solution can be an ideal solution due to the high scalability of the data storage but also of the computing power, in order to adapt the reporting infrastructure to the demand even at short notice and to optimally use resources.
Without the use of the cloud, reporting is usually done on locally hosted systems or databases. The analysis of large amounts of data can be slower due to limited resources and capacities of the local systems or require batch nights in which the report data is precalculated. In addition, hardware operation and maintenance is expensive and time-consuming. Demand fluctuations can only be responded to slowly, so in reality systems are often either overloaded or cost resources unused. Here, a cloud solution can be more cost-effective and does not require high investments in hardware, installation and maintenance. In addition, it is possible to get started quickly with cloud solutions. Often, the creation of a first PoC succeeds in a few days, while the set-up of classic system landscapes requires several months.
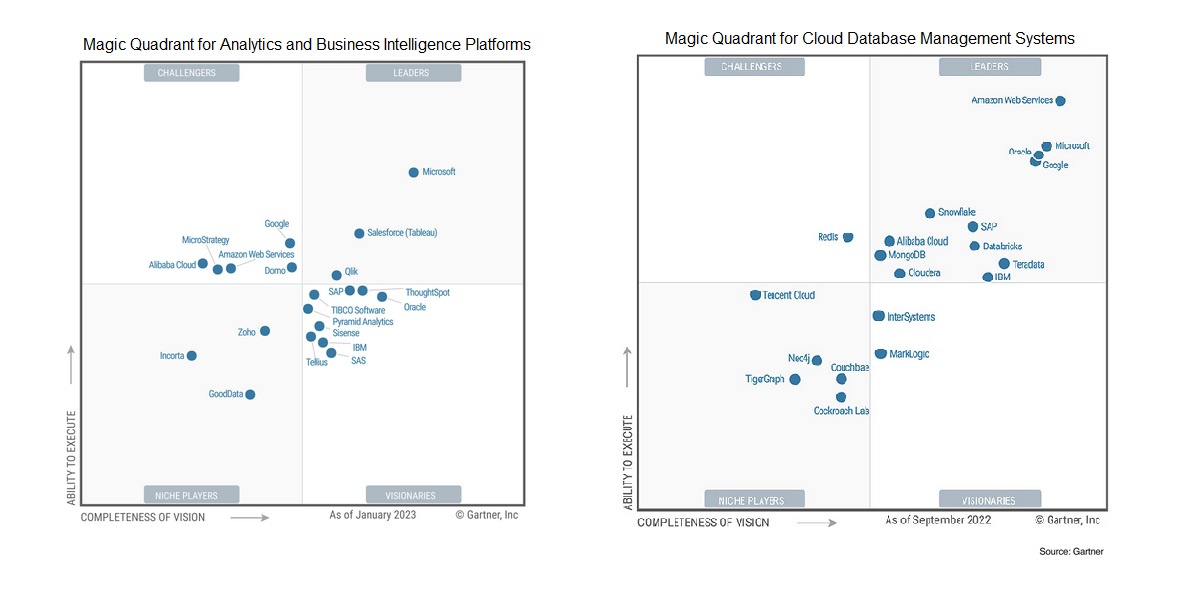
In this article, we present our preferred technology stack for cloud reporting. We have chosen Snowflake as our Data Management Solution Software and Power BI as our Self-Analytics Platform – both are considered market leaders in their field according to Gartner and are continuously developing their functionalities. We are focusing on a cloud DWH with a connection to Power BI. Although heterogeneous data formats can be stored in Cloud DWHs and both Snowflake and Power BI offer the possibility to prepare data, it is necessary to connect an ETL tool for data preparation, depending on the use case. Especially for use cases with a high heterogeneity of data as well as complex data pre-processing and data cleansing, the use of an additional ETL tool makes sense. Snowflake offers Snowpark for the implementation of complex data pipelines on the one hand and connectors to well-known ETL tools such as Talend or Informatica on the other.
Figure 1: Gartner squares on the topic of “Analytics and BI Platforms” and “Cloud Database Management Systems”
Overall, the planned technology stack looks like this: We bring together the data needed for reporting from different source systems in a Snowflake database. Then we import the required data via a database link (Power Query) into Power BI and create a report here. This can then be called up via mobile devices as well as stationary computers.
Figure 2: Data flow in cloud reporting with Snowflake and Power BI
Brief explanation of Snowflake and Power BI
Snowflake Inc. is a cloud-based platform provider from California whose main product is the cloud data warehouse of the same name.
Advantages are scalable computing power with costs relative to available power. The available computing power can be adjusted directly by the user with a click. There is no need to install software or purchase hardware; the platform can be accessed via the browser. Efficient use of storage space, correct configuration, monitoring, maintenance as well as updating to newer versions and security are ensured by Snowflake in the background. In addition, Snowflake offers a range of functions to integrate, transform and analyse data. This also includes the integration of data science tools, an easy connection of Snowflake to other products and complex query and analysis tools. Thanks to a role system, data protection aspects can be implemented, as users can only see data and perform queries for which their role is authorised.
A Snowflake data warehouse can be based on Amazon Web Service, Microsoft Azure or Google Cloud Platform and can contain data from different sources. Snowflake distinguishes between four different licensing models (Standard, Enterprise, Business Critical and Virtual Private Snowflake) with different features.
Power BI is a business intelligence platform from Microsoft. With the help of Power BI, reports and dashboards can be created and shared with stakeholders. The self-service functions enable an individual and interactive evaluation of the data provided.
For data preparation, report creation and provision, Power BI provides Power BI Desktop on the one hand and Power BI Service on the other. Power BI Desktop is a tool for local report and data processing. The Power BI Service is an online SaaS service. This service offers various functionalities such as the provision of Power BI reports, the provision of dashboards and the coordination of Power BI pipelines.
How does reporting work with Power BI and what role does the cloud play?
Power BI provides interfaces to numerous data sources, including cloud DWHs such as Snowflake. This data can be prepared in the integrated Power Query component. The entire ETL process, i.e. extracting, loading and transforming the data, can be implemented. The prepared data represents a dataset in Power BI. These preparation steps are carried out locally in the Power BI Desktop. In order to use the dataset for various reports, it can be loaded into the Power BI Service.
Reports are created either locally in Power BI Desktop or directly in the service – but with limited functionality. Datasets that have already been created can be accessed. To share the reports, they are loaded into the Power BI Service.
Connecting the Snowflake data source in Power BI and creating a report
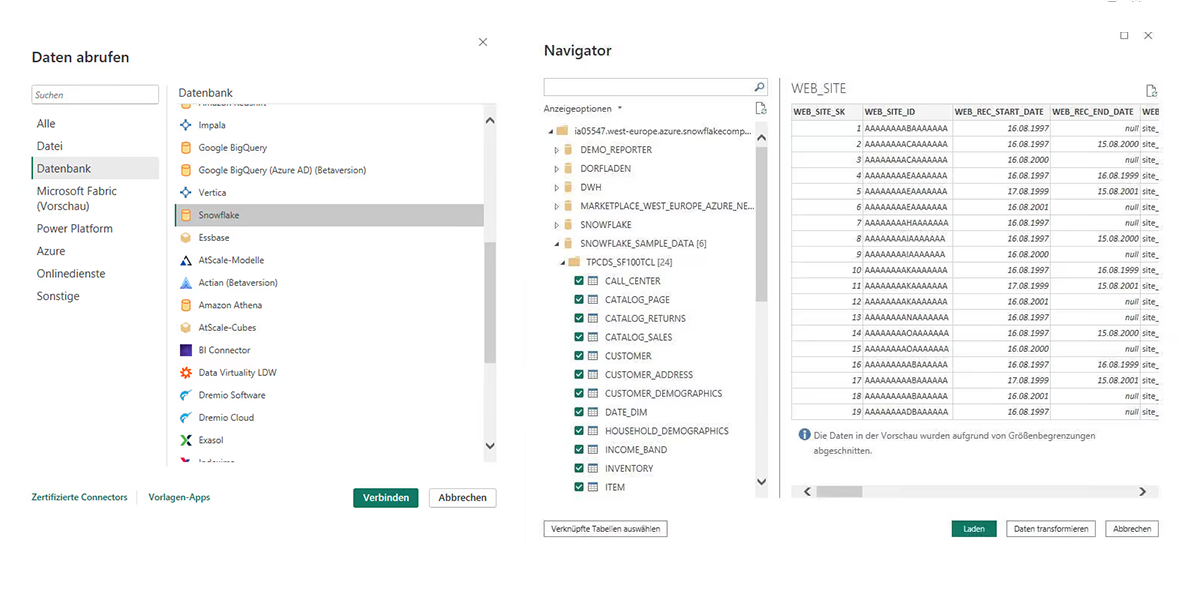
Power BI supports Snowflake as a data source. To create a report in Power BI based on Snowflake data, the Snowflake data source must first be connected. To do this, the prompt “Add data to report” appears directly after opening Power BI: Click on “Obtain data from another source” to open a menu in which you can directly select Snowflake as the data source under the “Database” tab (see screenshot). Then enter the server address of your Snowflake instance and the warehouse to be accessed. Then you are asked to enter your Snowflake access data. After successfully configuring the data source, a preview of the data is generated in Power BI.
Figure 3: Data retrieval from a Snowflake database in Power BI and selection of which tables are to be imported into Power BI
The data is then available in the data view of Power BI. The model view of Power BI also displays a data model that Power BI sets up using columns with the same name. Power BI offers many options for preparing the data.
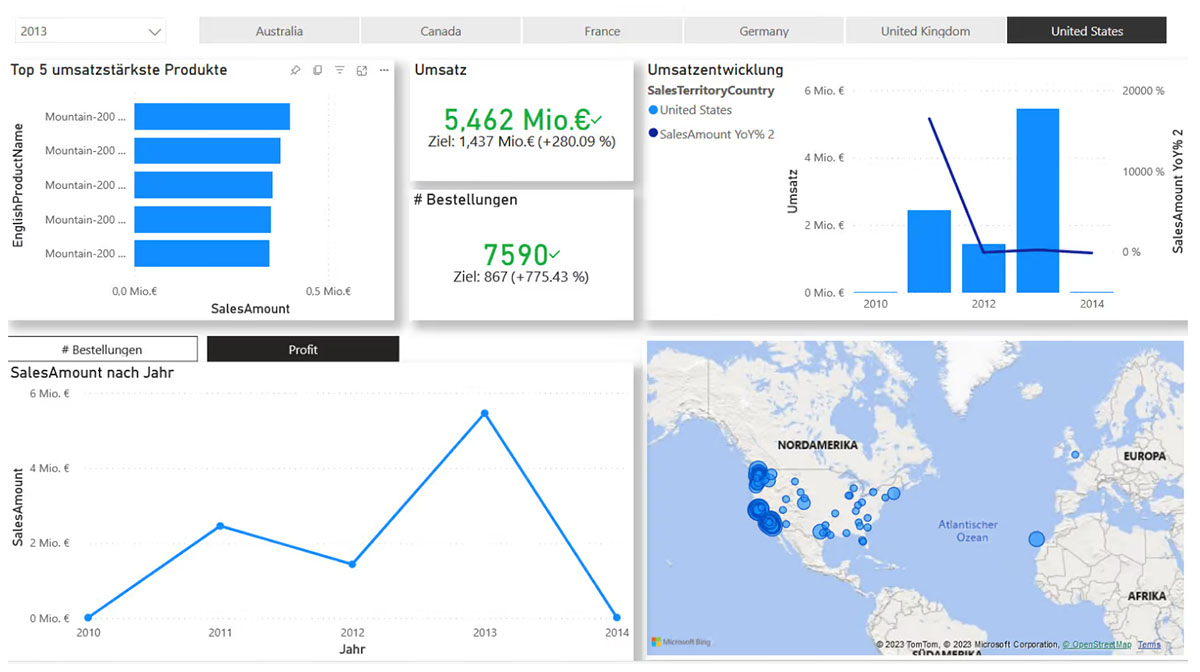
A report can then be generated. Power BI offers many practical visualisation types such as tables, maps or diagrams. To create a report, you drag and drop the desired data fields into the visualisations, which you then adjust to display the desired information. A report can then look something like this:
Figure 4: Example report generated with Power BI
Costs
Power BI offers different licence models. Power BI Desktop is free and can be used for data preparation and report generation. To share reports in the cloud, Power BI Service is required. To use Power BI Service, a Power BI Pro licence is required (9.40€ per user/month). Each person who wants to use shared reports also needs a Power BI Pro licence. Other functionalities, such as deployment pipelines, can only be used with a Premium licence (18,70€ per user/month or 4.675,60€ per capacity/month).
In Snowflake, costs are incurred for storage space usage, computing power and the use of cloud services. Only the actual consumption is charged. For storage space, there is a monthly fee based on the average storage space consumption after compression. Snowflake counts the computing power used in the unit “credits”. The greater the computing power of the warehouse, the more credits are consumed1. In addition, Snowflake offers a resource monitor to control the costs incurred and to avoid unexpectedly high costs. Resource monitors can be set so that the warehouses are automatically shut down as soon as a certain financial limit is reached.
Data protection
Data protection in the cloud is often a critical issue. Especially with personal data or confidential business data. Both Snowflake and Power BI offer solutions on the topic of “data protection”.
Snowflake works with a role concept so that each user can only view data according to their role. In addition, masking policies can be set up by the administrator so that particularly sensitive data is displayed in a censored manner. Furthermore, when setting up the Snowflake database, one can freely choose the cloud provider (Microsoft Azure, Google, Amazon Web Services and Google Cloud Platform) and decide on a region in which the data is to be stored geographically. There are three global geographical segments (North/South America, Europe and Asia-Pacific). Regions also determine where computer resources are made available.
Power BI also comes with features to ensure data protection. Microsoft establishes various security standards for handling data in the cloud services. These include, among other things, the encryption of data, as well as the configurability of the location and the data centres used. In addition, a comprehensive access control for the reports is integrated both for persons or groups of persons as well as for the data at row level (row-level security).
Detailed information on the topic of cloud and data protection can be found in the Notes2.
Advantages of cloud-based reporting
The advantages of cloud data warehouses are many:
Scalability:
While on-premise reporting generates high maintenance efforts and costs for servers, these costs are significantly lower with cloud solutions. The resources used can be scaled according to demand. Snowflake scales and replicates the warehouses automatically according to the set parameters. In this way, the warehouse has good performance even under peak loads and generates low costs at less compute-intensive times. Power BI capacities use cloud platforms to scale the reporting resources depending on the load.
Low barrier to entry:
The initial investment in a cloud DWH solution is lower than for traditional on-premise solutions. It is not necessary to first invest in the infrastructure and its development, but it can be built on existing resources. A move of smaller projects is easier to realise due to the high scalability.
Reliability:
Cloud DWHs offer a high level of reliability. Redundant infrastructures ensure access to the data even in the event of a failure. In addition, cloud platforms integrate back-up and recovery mechanisms so that access to a previous state is possible in the event of data corruption or loss.
Cost savings:
Cloud reporting offers potential cost savings through automatic scaling depending on the workload, as only the required resources are provided. In addition, the effort for maintenance and operation of the infrastructure is reduced, since, for example, updates and maintenance activities are carried out by the cloud provider.
Collaboration and accessibility:
Cloud services enable worldwide accessibility of data and reports. This is a key advantage, especially for distributed teams or globally operating companies. Power BI offers a high level of collaboration here through the possibility of reusing datasets loaded into the Power BI service or combining individual pages of reports into shared apps.
Conclusion and getting started
Cloud solutions are an ideal choice for companies that need real-time analysis of big data, due to the high scalability of data storage and computing power.
However, fears that cloud solutions would incur too high costs and data protection concerns often lead to companies not venturing into the cloud. The market leaders of cloud solutions have long been aware of these concerns and provide features to improve data protection and cost controlling. It is worth looking at these functions and trying out the cloud for a certain setting in order to then decide whether the functions are sufficient for one’s own use case.
In general, getting started with cloud reporting is easier than expected. By downloading Power BI Desktop3 , you can develop reports directly without a licence and work through exercises4 to become familiar with the solution. Snowflake even offers a free Data Warehouse Workshop5. Here, a PoC can be created quickly and companies can try out cloud reporting for themselves.
In the long term, this setting can enable data mesh structures in the company6.
Notes (mostly in German):
Are you interested in setting up an automatic data export for the creation of a first dashboard (e.g. with PowerBI) and an evaluation by professional Data Scientists and Agile Coaches? Then please contact Dr. Ina Humpert and Ronja Köhling.
[1] Preisliste Snowflake
[2] Sind meine Daten in der Cloud sicher?
[3] Download Power BI Desktop
[4] Power BI Uebungsaufgabe
[5] Kostenloser Workshop von Snowflake zu Data Warehousing
[6] Ausblick Datenarchitektur Data Mesh mit Snowflake
If you are interested in further specialist articles from the areas of business intelligence, artificial methods, test automation and business process management, then please take a look at the viadee Unternehmensberatung AG blog. It is worthwhile!
If you like the article or want to discuss it, feel free to share it with your network.
Ronja Koehling and Dr. Ina Humpert have published another article in the t2informatik Blog:

Ronja Koehling
Ronja Koehling is a consultant at viadee. Her current focus is on data science, including machine learning, operations research and process mining. She is responsible for training in the area of Power BI. She is currently supporting the development of an event data infrastructure with a cloud native approach to create the basis for process mining.

Dr. Ina Humpert
Dr. Ina Humpert is a mathematician and works as a consultant at viadee IT-Unternehmensberatung. Her focus is data engineering on SQL-based databases. For the past two years, she has been active in a reporting project in which a data warehouse is being further developed on the basis of which reports are created. She is also interested in agile topics and their interfaces to the field of data science. She is in active exchange on these topics with the organisational developers at viadee.


