What is a Velocity Chart?
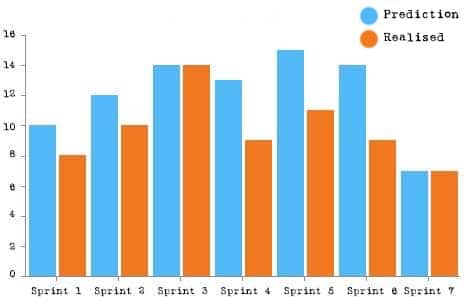
Smartpedia: The Velocity Chart visualises as a bar chart the sum of the story points promised and realised per sprint. It helps to determine velocity and sprint planning.
Velocity Chart – the comparison of promised and realised story points
In Scrum, the speed of a team is measured by velocity. It is determined as the average of the realised Story Points over several sprints. The velocity chart is a bar chart that shows the sum of committed and realised story points per sprint. It is a tool for determining velocity and sprint planning.
In sprint planning, the team agrees to implement defined user stories in the next sprint. The estimated effort of these user stories is often recorded in story points – some organisations work alternatively with hours, business values or number of tasks. The sum of the committed story points is entered into the velocity chart with each new sprint. This representation is supplemented at the end of a sprint – usually in the course of the sprint review – by the story points actually realised.
The Velocity Chart shows the following as a bar chart
- the story points on the y-axis,
- the sprints on the X-axis, and
- the concrete story points per sprint promised by the team, and
- the actually realised story points per sprint as bars.
Basically, velocity is a tool to measure the speed of teams over a period of time. In addition, it is also a tool for planning upcoming sprints, whereby planning based on average values does not take into account “special” situations and circumstances. The velocity chart makes it easy to contrast planning and reality. However, it should NOT
- be used for comparing teams or
- be taken as a measure of team effectiveness.
The chart also shows very clearly the velocity offset as the difference between committed and actually realised story points. As a result, the Product Owner, the Scrum Master and the developers can discuss the reasons that contributed to the deviation – perhaps the planning was too optimistic or there were impediments – and try to learn from it in the next sprint planning.
Notes:
The term velocity does not appear in the current Scrum Guide 2020. Although it was not mentioned in the previous version of the Scrum Guide either, very many organisations use velocity as a tool for planning and risk control.
Here you will find an article about the velocity trap.
If you like the article or would like to discuss it, please feel free to share it in your network. And if you have any comments, please do not hesitate to send us a message.
And here you will find additional information from our Smartpedia section:


