What is a Tree Diagram?
Smartpedia: A tree diagram is a graphical representation that visualises hierarchical dependencies between individual elements of a network.
Tree diagram – visualise the structure of dependent elements
How can hierarchical dependencies between individual elements of a network be visualised? The answer is: with a tree diagram. The name is derived from the appearance of the diagram, which is reminiscent of a tree (upside down or lying on its side) with a branched structure.
The advantages of a visualisation with a tree diagram lie in
- the simplicity of the representation,
- the comprehensibility of the dependencies and
- the clarity of the visualised information.
Types of tree diagrams
Tree diagrams – alternatively also known as tree graphs or branch diagrams – are used in a wide variety of areas, e.g. as
- family tree,
- cladogram for displaying the relationship of different living beings,
- in mathematics in the visualisation of (multi-level) random experiments and probability calculations,
- phrase structure diagram for structuring texts,
- organisation chart for business organisations,
- decision tree.
According to PMBOK and DIN 69901, the work breakdown structure should be displayed in the form of a tree diagram. In project management, the diagram is also used to represent costs, resources or project organizations.
A special form of the tree diagram is the mind map, which is well suited for the representation of complex connections, but also allows cross connections – in the sense of associations.
Elements and Rules for the Tree Diagram
The following elements and rules apply to the display:
- There is a start node (the root of the tree). The start node is at the top structure level. Visually this means that a tree diagram is built from the start node (in the western project world) from top to bottom or from left to right.
- Each node can branch to any number of nodes in exactly the structure level below it. With the exception of the start node, each node can have exactly one connection in the hierarchy to the top or to the structure level above it.
- The structure levels do not overlap and have no common nodes.
Examples of tree diagrams
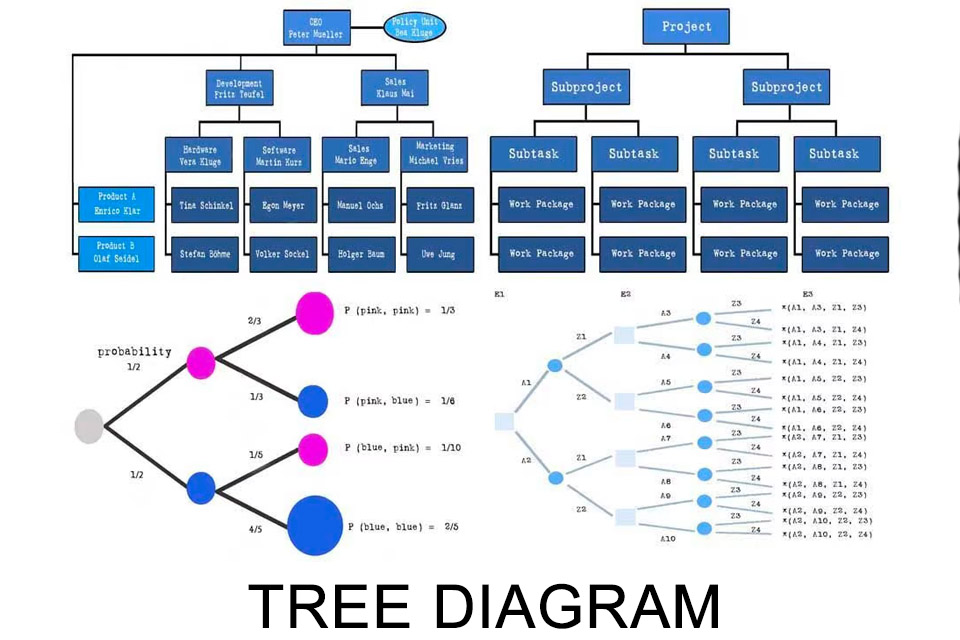
Here are four examples of tree diagrams:
- an organisational chart,
- a work breakdown structure,
- amulti-level random experiment,
- and a decision tree.
Tree diagram – advantages and disadvantages
Visualising information using a tree diagram offers advantages and possibly some disadvantages.
The advantages include:
- The areas of application are manifold.
- Visualisation is simple. It is easy to create and the information is easy to understand.
- No special previous knowledge is needed, especially since the form of visualisation is widespread and therefore well known.
Possible disadvantages could be:
- Depending on the form of representation, there is information that is interpreted independently of the representation. In an organisational chart, for example, the hierarchy of areas is often equated with the hierarchy of communication. This does not have to be the case in reality, but the impression is easily conveyed. A parallel classification or explanation may therefore be important.
- Even if the representation is simple, the more information is visualised in a tree diagram, the more confusing the whole thing becomes. Most visualisations have this problem in common.
- The practical use varies depending on the area of application. In companies, for example, it can be observed that organisational charts are not always up-to-date, but correspond to older organisational structures. This is a clear indicator of a lack of usefulness in daily work. And with other forms such as the decision tree, the benefit is also reduced over time. In practice, a revised decision rarely leads to a revision or re-evaluation of a decision.
Notes:
Here you can find a German video about tree diagrams.
If you like the article or would like to discuss it, please feel free to share it in your network. And if you have any comments, please do not hesitate to send us a message.


