What is a State Diagram?
Table of Contents: Definition – Important terms – Questions from the field – Download – Notes
Smartpedia: A state diagram visualises a sequence of permitted states that an object can assume in its lifecycle, including state transitions. It is used to describe the behavior of a system, subsystem, component, or class.
State Diagram Definition
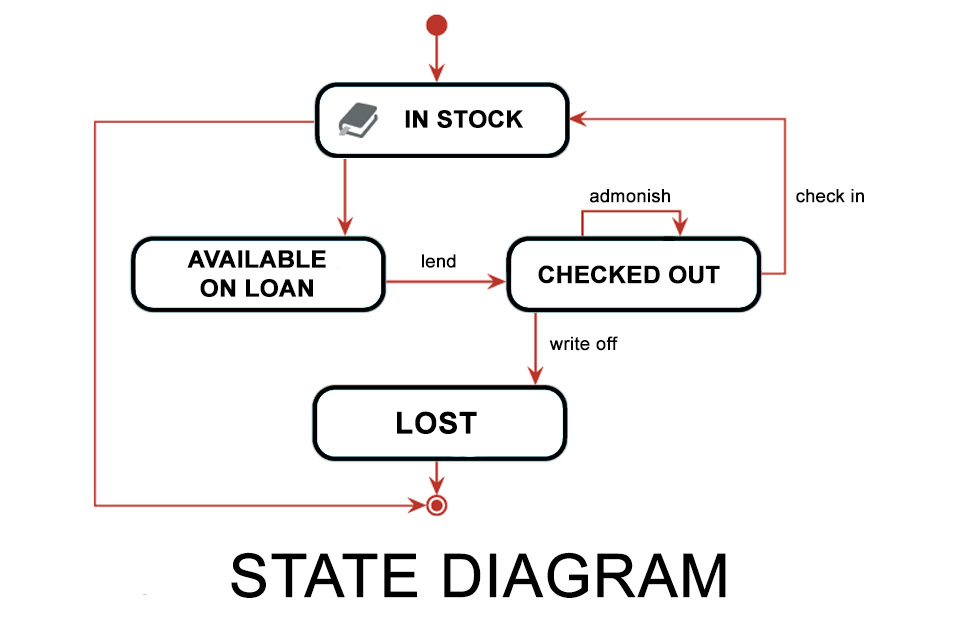
A state diagram – also known as state chart, state machine diagram or state transition diagram – visualises a sequence of states that an object can assume in its lifecycle. It is used to describe the behavior of a system, subsystem, component, or class. The use of system interfaces can also be specified by state diagrams. Particular attention is paid to the transitions between different states of the object, the triggering actions and the properties of the object that it possesses or must possess before the state change.
Explanations:
Initial state: A state diagram begins with an initial state, also known as a pseudo state.
Decision node: A decision has to be made after adding the points. If you score 100 or more, the exam is passed, if you score less, you fail.
Fork: If the exam is passed, the grade has to be determined and then published and the study certificate issued.
Join: After a forking follows a join .
Final state: The state machine ends with the final state, which is reached in two ways: by failing the exam and by publishing the grade and issuing the study certificate.
What are important terms in state diagrams?
The Finite State Machine
A state diagram shows a sequence of states of an object and visualises the actions by which state changes occur. A state diagram thus describes a finite state machine with a number of finite states at any given time. A machine is finite if the set of states it can assume is finite. The machine stores the states that have passed through from system start to the current point in time. A change of state indicates a change and is described by logical conditions. The state transition is only triggered if these conditions are fulfilled.
States
The UML 2.5 distinguishes between three types of states:
- the simple state,
- the composite state
- and the submachine state.
A simple state has no sub-states and can include various activities and transitions. In principle, the following prerequisites must be fulfilled when modeling objects in state diagrams:
- The object is always in exactly one of the defined states.
- The object is never in any of the defined states.
- The object is never in more than one state at a time.
Sub-states are possible with the composite state. For example, a door could know two states unlocked and locked and be open or closed in the unlocked state. Open and closed would be corresponding sub-states.
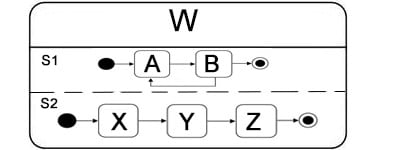
The submachine state describes a state that contains sub-states that are represented in a subordinate state diagram. States, which are composed of several sub-states, are also called complex states. If the complex state and exactly one sub-state are active, one speaks of disjoint sub-states. By dividing the state into regions, substates can also be concurrent and active at the same time. This is called orthogonal state or super-state.
Here you can see a complex state in which a sub-state of the two orthogonal regions is active for a certain state. A or B can only be active at one time and X or Y or Z can only be active at one time. This results in the following combinations of simultaneously active states: AX, AY, AZ, BX, BY, BZ. The combination with the end states S1 and S2 is also possible: AS2, BS2, S1X, S1Y, S1Z, S1S2.
Transitions
State changes from one state to the next are called transitions. They are triggered by events. Transitions connect two states, i.e. a source node and a destination node. The transition can be linked to a behavior specification that describes the behavior that leads to the state change. The triggered behavior is called an effect. In addition, there are guard expressions that ensure that transitions are only run through if the guard expression is true.
There are two types of state transitions:
- Inner transitions are the reactions to an event that triggers an activity but not a state transition. No entry or exit activities are performed due to the missing state change (see events).
- Outer transitions lead to a change of state due to the reaction to an event. Possible entry or exit activities are also executed accordingly. A special external transition is the self-transition, in which the source state and the target state are identical.
Events
Events trigger transitions. They consist of a name and assigned arguments. A state can attach conditions to an event that must be fulfilled before a specific state can be assumed by an event. There are basically three possible behaviors for an event:
- A behavior that is executed when the state machine enters the state (entry behavior).
- A behavior that is executed when the state machine leaves the state (exit behavior).
- A behavior that is executed as long as the state is not changed (do activity).
In addition, there is also a behavior that is executed when an event occurs, e.g. a “peep” noise during a mouse over. In addition to such signal events, there are call events for the reception of messages, time events for state transitions over time or at defined times and change events. In the case of a change event, a condition is permanently checked and a corresponding change of state is triggered if no monitoring condition blocks this. In contrast, a condition is only checked if an assigned event occurs. The condition itself cannot trigger a state transition.
Questions from the field
Here are some questions and answers from the field:
What are pseudo states?
Pseudo States
In addition to the three types of states, there is a general classification of states: real states in which a system can be permanently located and pseudo states that a system cannot permanently occupy.
The pseudo state is an element that influences the process of a state machine. It is not a real state, because there are no value combinations that this state represents.
The UML 2.5 knows ten different pseudo states. Each describes a special property that controls the state transitions:
- initial state
- final state
- fork
- join
- junction
- choice
- entry point
- exit point
- shallow history
- deep history
History states are used if a transition is to return to the same state that was active before the transition occurred. With the shallow and the deep history state, there are two types of history states. The shallow history restores the previous state at the same level, while the deep history state activates the last active sub-state over an entire nesting depth. In principle, each state may only have a maximum of one shallow and one deep history state.
What are discrete states?
An example of this is a traffic light with the states red, amber and green, between which it changes according to fixed rules.
State diagrams are less suitable when a system does not have clearly separable states. Examples include:
- A thermostat that continuously regulates temperature instead of switching between fixed ‘cold’ or ‘warm’ states.
- A neural network or AI model in which states are probabilistic or dynamic.
- parallel processes in which several states can occur simultaneously, such as in software multithreading.
A state diagram is therefore particularly suitable when the system can be divided into clearly defined states with unambiguous transitions.
What are typical applications for state diagrams?
State diagrams are often used in embedded systems for monitoring, controlling and regulating functions or for data or signal processing. Embedded systems – as a combination of software and hardware – often perform services invisibly for the user in cars, airplanes, refrigerators or elevators. They control cash dispensing at ATMs and ensure Aqua Stop at the dishwasher.
Entire economic sectors such as medical technology, the entertainment industry, the communications industry or transport rely on embedded systems and thus also on state diagrams. And even in different areas of the company that take care of product production in the broadest sense, such as product and project management or requirements engineering, the use of state diagrams is widespread.
Where does the state diagram originate?
State diagrams are based on a concept by David Harel, an Israeli professor of computer science, who published Statecharts: A Visual Formalism for Complex Systems as early as 1987. [1] Only later was the state diagram included as one of 14 diagram types in the Unified Modeling Language (UML) and identically constructed in the Systems Model Language (SysML). The concept was extended by hierarchically nested states, orthogonal areas and actions, which can depend on the state of the system and a triggering event at the same time. The use of entry and exit actions, which are more condition than action oriented, was also integrated. Thus, UML state machines have adopted properties of the Mealy [2] and Moore [3] machines.
UML 2.5 also defines behavioral state machines, which model the behavior of systems, system parts or instances of a class, and protocol state machines, which document protocols implemented by a system element.
What are the advantages and disadvantages of state diagrams?
State diagrams are a very good tool for describing systems and their possible behaviours. They offer the following advantages:
- The life cycle of an object, from initialisation to release, can be modelled. This increases the common understanding of the modelled object among those involved.
- The permitted states of an object and the events that are triggered by state transitions can be described. This makes the behaviour of the object visible and comprehensible.
- They are easy to use in many situations, especially since even inexperienced readers can easily understand them with a little practice.
- They help to structure and visualise complex processes, enabling errors and discrepancies to be detected at an early stage.
- They can serve as documentation for the subsequent maintenance and further development of a system, as they provide a clear and precise representation of the system’s behaviour.
- They are well suited for simulating and validating systems before they are implemented.
Despite their advantages, there are also some challenges in using state diagrams:
- For very complex systems, the diagram can quickly become confusing, especially if there are many states and transitions.
- Creating a detailed state diagram can be time-consuming, especially if many special cases need to be considered.
- Not all systems or processes can be meaningfully represented with state diagrams, especially if the behaviour cannot be clearly described by discrete states.
- Changes to the system often require the diagram to be adapted, which means additional maintenance effort.
- Some developers prefer other modelling methods such as activity diagrams or sequence diagrams, as these may be better suited for certain use cases.
What tips are there for using state diagrams?
State diagrams can be used universally, but they should be used selectively, especially for complex systems or processes where they offer real added value. For simply structured objects, however, their usefulness may be rather limited. To ensure a consistent and comprehensible presentation, it is recommended to use standardised notations such as UML 2.5 or its equivalent in SysML. A well-structured state diagram should run from top left to bottom right to allow intuitive reading.
Since too many details can impair clarity, it often makes sense to outsource complex relationships to subordinate diagrams. At the same time, it should be checked whether state diagrams are the best form of presentation or whether they should be supplemented by other methods. It is particularly important that the states and transitions are clearly defined and that the system can be clearly described by discrete states.
To ensure that state diagrams fulfil their purpose as well as possible, they should be tailored to the target group. Developers often need detailed technical representations, while a simplified, clear version can be more helpful for managers or customers. With well-thought-out design and targeted use, state diagrams can be used efficiently and effectively.
Impulse to discuss:
How could AI-supported systems help to automatically generate state diagrams and what challenges could arise in the process?
Notes:
[1] Statecharts: A Visual Formalism for Complex Systems
[2] Mealy machine
[3] Moore machine
If you like the article or would like to discuss it, please feel free to share it in your network. And if you have any comments, please do not hesitate to send us a message.
Here you will find additional information from our Smartpedia section:
