What is a Precedence Diagram?
Table of Contents: Definition – Characteristics – Advantages – Elements – Process Node – Buffer – Duration of Activities – Critical Path – Forward Planning – Backward Planning – Download – Practice – Notes
Smartpedia: A precedence diagram displays activities, their duration and temporal arrangement as well as logical dependencies graphically or in tabular form.
Precedence Diagram Definition
DIN 69 900, which describes methods for scheduling and scheduling in project management, defines precedence diagrams as “graphical or tabular representation of a process structure consisting of activities or events and relationships”. A precedence diagram thus represents individual activities, their duration and temporal arrangement as well as logical dependencies, and enables the calculation of start and end times of activities as well as the calculation of buffer times.
With a precedence diagram, it is possible to describe entire projects or “only” subprojects as an overall structure or partial structure. Partial precedence diagrams are linked with other partial precedence diagrams; depending on the direction of view, this is referred to as segmentation or summarisation. The advantage and also the challenge lie in the depth of detail of the visualisation according to the needs. Example: The management is interested in the milestones of a project, the employees in the details of the processes.
The two best-known precedence diagram methods are CPM – Critical Path Method – and PERT – Program Evaluation and Review Technique. Originally, they were designed as scheduling methods. Since other factors such as costs, resources or quality are used to control projects in addition to deadlines, there are also different variants of precedence diagrams.
Precedence Diagram Characteristics
A precedence diagram forms the basis for scheduling and has the following characteristics:
- It helps to determine the total duration of a project.
- It determines the chronological and logical sequence of the activities in a project.
- It displays the critical path and thus the activities that could endanger the planned end of the project.
- It represents possible buffers or reserves in scheduling.

Advantages of Precedence Diagram Method
Precedence diagrams are well suited for project planning, because
- they help to identify activities that are necessary to fulfil tasks and thus to achieve the project goals.
- they require the definition of logical and temporal arrangements of the processes and therefore help to identify potentially critical aspects at an early stage.
- they visualise the activities that follow the critical path and are essential for the achievement of deadlines or project goals.
Precedence diagrams should also be used for project management, because
- early identified resource bottlenecks on the critical path can be avoided if necessary.
- buffers can be actively integrated into the scheduling so that employees can be deployed flexibly.
- they promote the understanding of those involved, communication and control.
- they enable the prognosis of milestones, the project duration and the project end.
- through continuous updating they are a continuous and not only an initial aid in project management.
The Elements of a Precedence Diagram
Precedence diagrams are a means of graph theory, consisting of nodes and arrows. A network has three essential elements:
- A process is an activity with an earliest and latest start and end time.
- An event is a defined, describable state in the course of a project.
- A interrelationship of activities defines the logical – i.e. functional, technical and also personnel – and time dependency between individual processes; it always exists between exactly two nodes.
Depending on the characteristics of a precedence diagram, nodes can represent activities or events and arrows can represent activities or interrelationships of activities. The meaning depends on the precedence diagram methods you have chosen. In project management, usually the activity node and not the activity arrow is used. It uses nodes to represent project activities and links them with arrows as interrelationships.
The Process Node in a Precedence Diagram
The activity node is usually represented in the precedence diagram as a rectangle and sometimes as a circle. It has an activity name and an activity number or index. Further information is the duration of the activity, two dates for the start and two dates for the end of the activity, and two values for buffers.

The Buffer
The buffer of an activity is the duration by which the activity could be delayed without affecting the duration of the overall project. A buffer is therefore a reserve or a time cushion. It is created by activities that are processed in parallel and have different processing times. If a shift is smaller than a defined buffer, this has no effect on the intended end of the project.
The precedence diagram method knows two different buffers: The total buffer specifies by how many days an activity can be moved without moving the latest possible start time of the subsequent activity. The free buffer indicates how many days an activity can last without affecting the earliest possible start time of the subsequent activity. The free buffer of an activity can never be larger than the total buffer of the activity.
The Duration of Activities
In the PERT method, the arrows between two nodes correspond to the activities. The nodes themselves are events, whereby the start and end events are particularly highlighted types of events. The time to perform an activity is determined using a three-time estimate. PERT therefore knows three different time estimates: the minimum or optimistic ( to ), the most frequent or probable ( tw ) and the maximum or pessimistic ( tp ) time estimate. The expected time ( te ) can be calculated from these three values using the following formula – also known as the beta distribution:
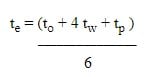
This approach also leads to a change in presentation, where time estimates are displayed at the arrows rather than in or at the nodes:

The Critical Path in a Precedence Diagram
In the course of a project, there will always be a series of activities whose buffer time is zero. Buffers result from parallel activities that are both predecessors of a particular task. The shortest of the parallel activities has the longest buffer time, the longest of the parallel activities has no buffer. If a delay occurs during this activity, the entire project is delayed. In the CPM method, these activities are referred to as critical events, critical tasks, or critical activities. The path through which all critical activities in a project are linked together is the critical path. It determines the minimum project duration. In a precedence diagram, this critical path is often highlighted in color – usually red – or by a dashed line. It is also customary to name the index values in the order of the activities.
In projects it can happen that the critical path forks and thus takes concurrent paths; however, it always has only one start time and one end time. With several parallel, critical paths, the risk increases, because even a small delay in an activity leads to a delay in the entire project. Nevertheless, a critical path is important because it allows all time-critical activities to be identified on the one hand and the overall project duration to be shortened through time savings on the other. Basically, there are several ways to shorten the overall duration of a project:
- carry out activities in parallel and not sequentially,
- assign additional resources to critical activities,
- accelerate critical activities through automation.
The Forward Planning
With the forward planning, the earliest possible start and end time of the activities is calculated. The following rules apply:
- In the first activity of a precedence diagram, the ESP (earliest start point) = 0.
- The EEP (earliest end point) is the sum of ESP + D (duration), so EEP=ESP+D.
- If an activity (follow-up activity or successor) has several predecessors, its ESP(s) corresponds to the latest EEP(p) of the predecessors.
Particular attention must be paid to the interrelationship between operations during forward planning:
- A successor can start as soon as the predecessor is complete (finish-to-start relationship, FS relationship or normal sequence):
ESP(p)=EEP(s)+delay(s). - If both activities end at the same time (finish-to-finish relationship or end sequence), the following applies:
ESP(s)=EEP(p)+delay(p)-duration(s). - If predecessor and successor start at the same time (start-to-start relationship or start sequence):
ESP(s)=EEP(p)+delay(p).
The buffers are calculated as follows:
- Total buffer (TB)=LEP-EEP or TB=LSP-ESP.
- Free buffer (FB)=ESP(s)-EEP(p).
The Backward Planning
The backward planning calculates the latest possible start and end time of the activities. The following rules apply:
- In the last activity of a network, the EEP (earliest end point) = LEP (latest end point).
- The LSP (latest start point) results from the ESP – duration, i.e. LSP=ESP-D.
- If an activity (follow-up activity or successor) has several predecessors, its LSP(s) corresponds to the latest end point of the predecessor LEP(p). If there is only one predecessor then LSP(s)=LEP(p).
For backward planning, the relationships must also be taken into account as follows:
- This applies to a finish-to-start relationship or normal sequence:
LEP(s)=LSP(p)-delay(p). - This applies to the finish-to-finish relationship or end sequence:
LEP(s)=LEP(p)-delay(s). - For a start-to-start relationship or a start sequence:
LEP(s)=LSP(p)-delay(p)+duration(s). - A process can end as soon as its predecessor starts (e.g. an old website can only be switched off if the new website is running). In the case of the so-called jump sequence or start-to-finish relationship:
LSP(s)=ESP(p)-delay(p)-duration(s).
LEP(s)=LEP(p)+delay(p)+duration(s).

Download the Precedence Diagram Guide for free now.
Everything important about precedence diagrams at a glance.
- definition and explanation of the planning technique
- visualisation and key figures
- explanations on forward and backward calculation, critical path and buffer times
- benefits and challenges
Knowledge on 9 pages to take away.
The Use of Precedence Diagrams in Practice
With the precedence diagram method, logical and temporal dependencies of activities and procedures in projects can be described and visualised. But are precedence diagram still used today? This question is certainly justified. In most projects, the bar chart – which is practically a time-scaled precedence diagram – has established itself. However, since precedence diagrams are very well suited for identifying the effects of parallel activities, they are often used where large planning steps – e.g. in construction projects – have to be recorded in their entirety. This can lead to a minimisation of the project duration, because through the occupation with critical activities and the provision of appropriate resources (employees, but also machines) throughput times can be reduced. In addition, precedence diagrams can be scaled so that different user groups can work with different partial plans and details.
The effort required to create precedence diagrams is relatively high, especially since all the necessary work packages must be known and fully defined in order to carry out a project. At the same time, the predictive power depends on the quality of the estimates for effort and duration. Practical experience in planning projects is therefore an important prerequisite. However, if these practical experiences are available, then a precedence diagram can be created quickly, read very easily and used well for project management.
How can the precedence diagram method also be used in agile projects?
Notes:
Here you can find an informative explanatory video about precedence diagrams in German.
If you like the article or would like to discuss it, please feel free to share it in your network. And if you have any comments, please do not hesitate to send us a message.
Here you can find additional information from our t2informatik Blog:

Intuition in Project Management

Mind Change in Project Management

New Learning in Projects