What is an Activity Diagram?
Smartpedia: A use case diagram visualises use cases with relationships to other use cases and other systems.
Activity Diagram Definition
An activity diagram is a means of expression of the Unified Modelling Language (UML), with which temporal processes within a system are described. Together with the use case diagram and the state diagram, it belongs to the group of so-called behavior diagrams. In a behavior diagram, individual aspects of a system and their changes at runtime are visualised.1
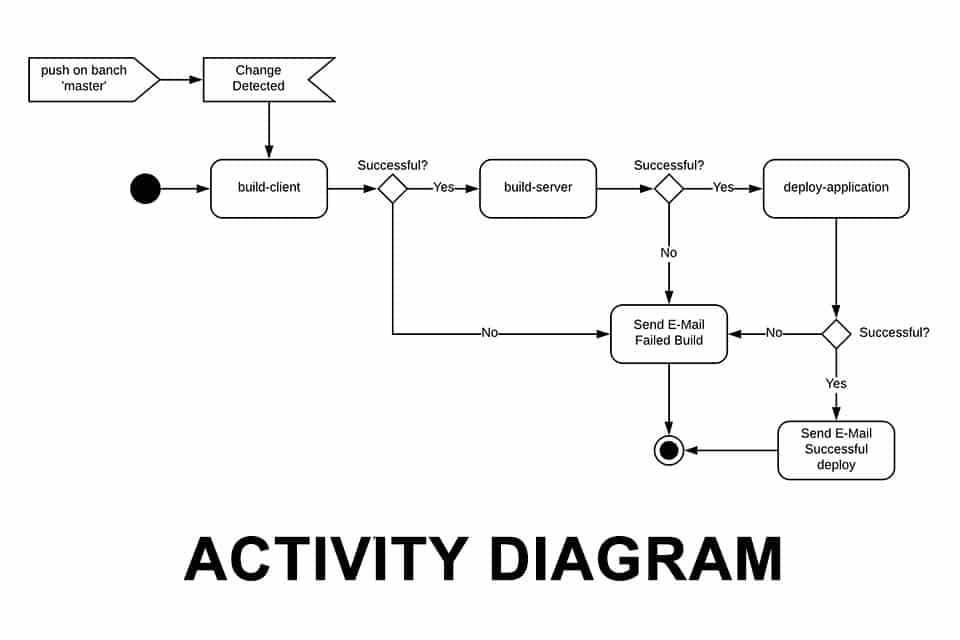
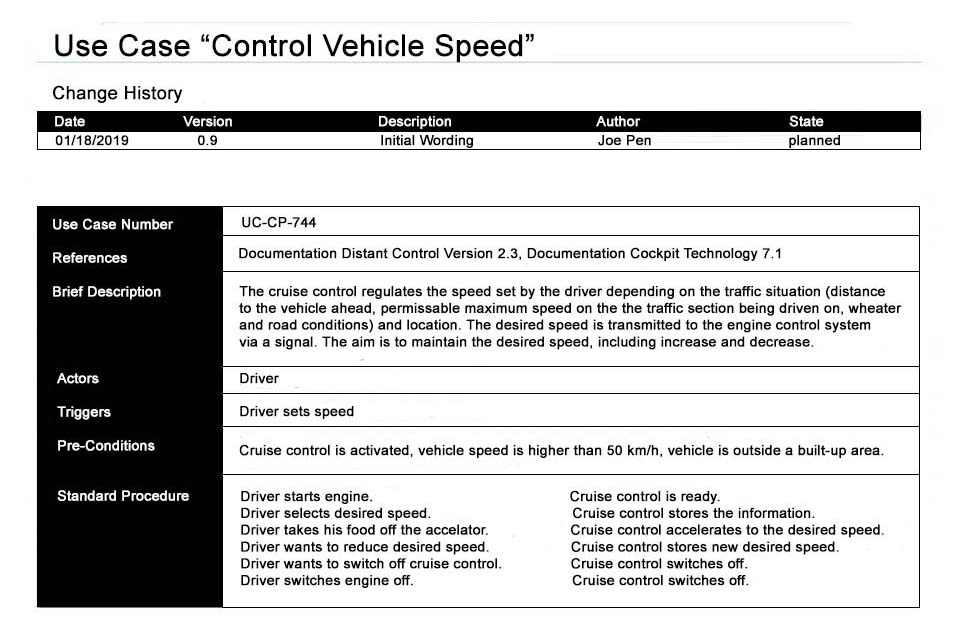
The activity diagram is used to model processes, such as those that occur in business processes, workflows, use cases or algorithms. It enables complicated processes with variants, parallel flows or repetitions to be clearly represented. Compared to textual descriptions, often written in natural language, it is usually easier to understand.
Essential Elements in the Activity Diagram
To understand activity diagrams, it is important to distinguish between different terms:
Activities and Actions
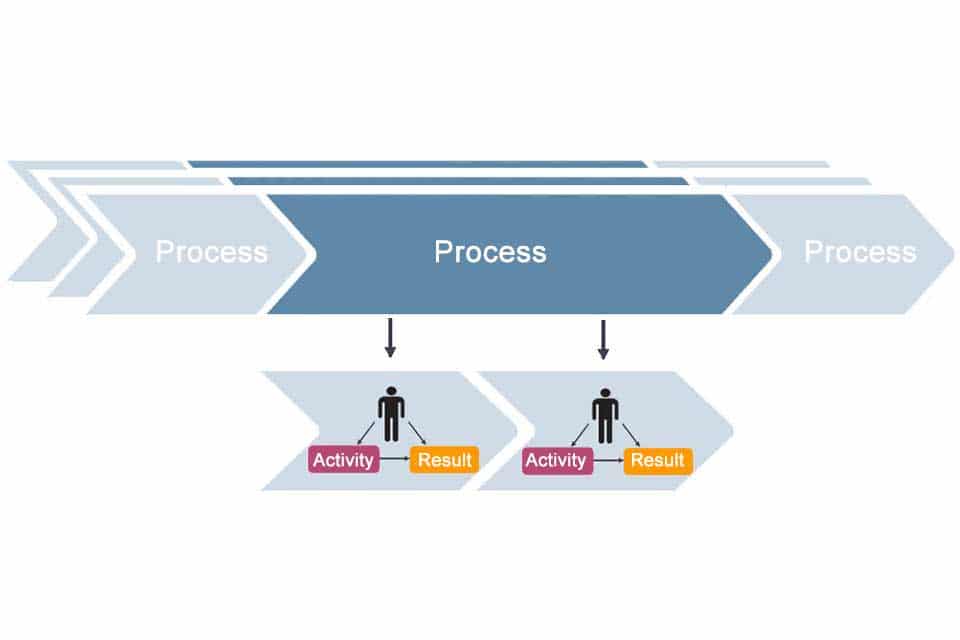
An activity describes the sequence of actions and can have input and output parameters as preconditions or postconditions that must apply when the activity begins or ends. It is represented as a rounded rectangle.
An action is an atomic component of an activity. It can be executed repeatedly and can call up other actions or activities. The sum of the actions determines the behavior of an activity. The UML categorises 44 types of actions, e.g.
- communication-related actions for signals and events,
- object-related actions for creating and deleting objects,
- variable-related actions such as setting or deleting individual values of variables, or
- link-related actions for navigation or for creating or deleting links between objects.
Actions are represented with rounded rectangles within an activity.
Nodes and Edges
In the UML 2.5 specification of the Object Management Group (OMG), the terms nodes and edges appear 1,986 and 786 times respectively.2 Edges are the connecting lines between nodes, nodes are the points where “something” happens.
Three types of nodes are distinguished:
- activity nodes,
- control nodes and
- object nodes.
Activity nodes represent both actions that receive inputs and process them into outputs for other nodes, or call up other activities, and groups of actions.
Control nodes direct the flow of an activity, including the specification of alternative flows through branches or unions. Control nodes include
- the initial node – also called the start node – as the initial starting point for a flow. If there are several initial nodes, activities are started in parallel; if the initial node is missing, all activities with no incoming edges start in parallel. The start node is represented by a black circle.
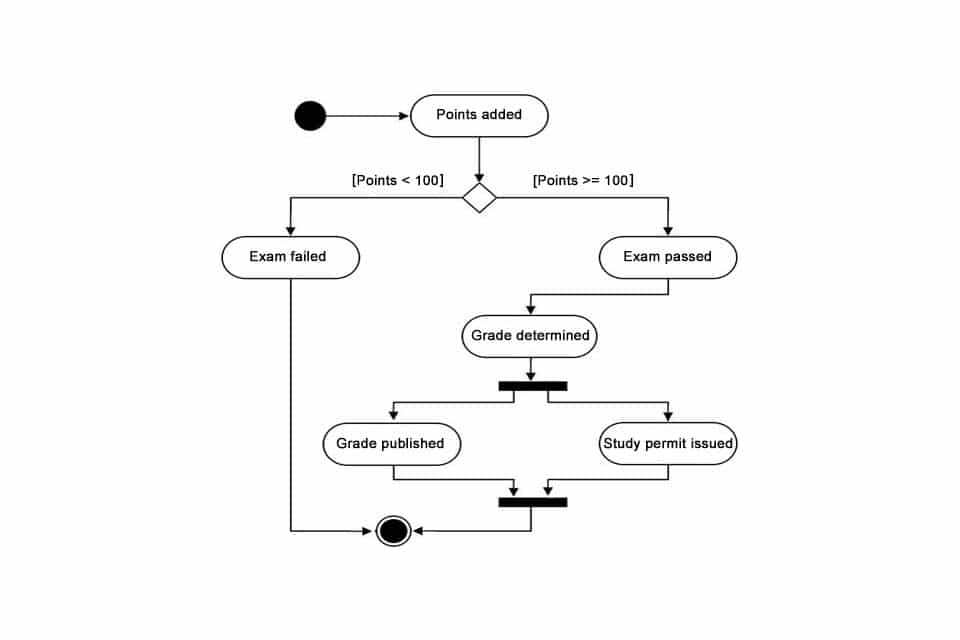
- the decision nodes, which offer explicit decision options – usually linked to conditions – for alternative processes. Implicit decisions exist when alternative sequences are represented without the use of a decision node; since this can lead to erroneous interpretations, implicit decisions should also be avoided. Decision nodes are represented as diamonds.
- the fork node as a point in an activity that divides a flow into several parallel or concurrent flows. This is also called splitting. The fork is represented as a bar with one incoming and several outgoing edges.
- the join node as a point in an activity where several flows are synchronised into a common flow; accordingly, we speak of synchronisation. The join is represented as a bar with several incoming and one outgoing edge.
- the merge node as a point in an activity where several edges are merged into a common edge without synchronisation. The merge is used when defining loops.
- the flow final, which ends the flow in an activity, but without influencing other flows in the activity. The flow end is represented by a crossed circle.
the end node or activity final for the immediate termination of all flows in an activity, even if activities have several end nodes. The end node is represented by a black circle with a white border.
Object nodes form the structure for transporting data and values within an activity during a process; their specification defines the flow of the objects. The object nodes include
- activity parameter nodes for passing parameters when calling actions. A distinction is made between input parameters or input pins and output parameters or output pins. A “special” input parameter is the value pin, which activates an action if the evaluation of a value specification provides a defined value.
- central buffer nodes, which act as buffers between incoming and outgoing edges, consolidating data from different sources, but without being directly related to actions. Data is persistently stored in data store nodes.
- expansion nodes used to specify a collection input or output for an expansion region. A collection input of an expansion region contains a collection that is broken down into its individual elements within the region and whose content is executed once per element. A collection output combines individual elements generated by the execution of the region into a collection for use outside the region.
Two types of edges can be distinguished:
- control flows or control flow edges and
- object flows or object flow edges.
While a control flow connects actions and activities and expresses a dependency between predecessor and successor nodes, an object flow additionally transmits data between the accounts. Visually, both manifestations are represented by a solid line with an open arrowhead, where object flows are drawn between object pins or activity nodes (recognisable by small rectangles at an action or activity).
Both control flows and object flows can be split with the buffer node; for example, data in a shopping basket can be temporarily stored via central buffer node and retrieved at a later time. If the process is terminated before retrieval, the corresponding cached data is deleted. When using the data store node, the data would be retained even when the process is terminated.
Partitions and Tokens
Among the frequently used elements in activity diagrams are partitions. A partition visualises the logical grouping of nodes and edges within areas of responsibility. Typical areas of responsibility distinguish, for example, roles, departments or subsystems. Example: Action 1 and 3 are carried out in department A, action 2 and 4 in department B. The separation of the different areas of responsibility is represented by so-called swimlanes. Hierarchical, multidimensional and external partitions are also conceivable.3
And last but not least, there are the so-called tokens. The token semantics is borrowed from Petri Nets, whereby a token corresponds to a flow thread that can be created and destroyed, and represents the progress in the flow – quasi by means of a virtual index finger. Since it is a coordination mechanism, tokens are not visualised in the diagram. The advantage of tokens lies in the possibility of automatically verifying activity diagrams and thus checking their correctness.4
Advantages of Activity Diagrams
Since UML version 2, activity diagrams have used process-oriented concepts or concepts to represent concurrent, communicating processes. Consequently, they offer notation elements that can be used to describe business processes, workflows, use cases or even algorithms.
In addition to this flexible use, the application of activity diagrams offers other benefits:
- Basically, they are easy to create and understand with a little practice.
- They offer different levels of abstraction and can declare areas of responsibility.
- They are suitable for modelling object-oriented and non-object-oriented systems.
- They can be supplemented with elements from other notations.
- They can be verified automatically.
- And the choice of tools that visualise activity diagrams is large.5
In short: activity diagrams are an excellent means of expression for representing processes.
Notes (partly in German):
[1] The Systems Modeling Language (SysML), which is based on the UML, also knows the activity diagram. There, too, it belongs to the group of behavior diagrams, although SysML declares the sequence diagram as another behavior diagram. In UML 2.5, the sequence diagram is listed as an interaction diagram.
[2] DoCumentation: OMG Unified Modeling Language Version 2.5
[3] Dr. Wieland Schwinger: Das Aktivitätsdiagramm
[4] Dissertation von Alexander Johannes Raschke: Zur automatischen Verifikation von UML 2 Aktivitätsdiagrammen
[5] Here you can find a list of UML tool vendors, all of which use the activity diagram as a central means of expression of UML.
Some publications point out that activity diagrams and project flow plans would be similar. A project flow plan shows the chronological sequence of work packages with the help of bars and complements the work breakdown structure. The project flow chart is usually visualised with a Gantt chart; thus it is obviously different after all, even though both charts represent activities. The proximity to flow charts, which are used to represent business processes, is, however, obvious.
There are numerous other means of expression used in activity diagrams, such as pseudo-states, signals, linking (structured) activities, call behaviour and call operation actions, etc. Here we recommend a look at the current documentation of the UML.
Here are 10 tips for optimisation of software development – a satire.
Here you will find an article about a picture worth a thousand words.
And here you will find additional information from our Smartpedia section:


