Keeping performance under control
Agile software development today avoids software systems being developed without the customer in mind. Functionally and also according to quality characteristics such as usability, the system meets the customer’s wishes. At the same time, the accompanying adaptations and extensions can lead to a deterioration in performance if this is not kept in mind at the same time. The end result is a system that implements all the desired functions but is perceived as slow and thus suffers from a lack of acceptance. Later changes in the use of the system can also have an impact on performance. Therefore, performance must not only be monitored during development, but permanently.
In the following, we will look at different aspects that influence the performance of a system. Each aspect requires a targeted approach in order to keep performance under control in the long run.
Response behaviour – on a large scale …
When talking about the performance of a system, the focus is often exclusively on its response behaviour. Even though this does not go far enough, as the aspects discussed below show, we also devote ourselves to this aspect first.
The response behaviour of a system can be determined very easily by measuring the time between stimulus and response of the system. Ideally, the system offers interfaces that can also be addressed from the outside. Tools such as JMeter1, Gatling2 or Locust3 allow the simple definition of load tests against various interfaces of a system.
Even if the measurement seems very simple due to tool support, the question remains what is to be measured and how the measurement results are interpreted. Measured values as pure numbers have no significance.
In order to make not only a quantitative statement, but also a qualitative one, the following questions should be asked before the measurement:
- What are the scenarios that are to be measured? Only realistic runs through the system are relevant for the end users of the system. An example of this is the average hour, i.e. a typical hour of user interaction in the life cycle of the system. The chosen scenarios are mapped in the tool of choice.
- What is the typical and maximum number of requests per time unit? The simulated requests should correspond to the real volume. This serves as the basis for the load simulated by the tool.
- What is the expectation? The measurement must be quantifiable in order to derive a qualitative statement: System meets the specified criteria or not.
The answer to these three questions serves as a blueprint and guide for the load tests. For the test execution, additional settings have to be made, e.g. how quickly the maximum number of parallel users should be reached (ramp-up time) or how the users are distributed in percent to the selected scenarios. The tool then takes care of the rest.
Since we also answered the third question in advance of the measurement, the interpretation of the measurement result is simple. Thus, the measurement result can be classified without a doubt and is not subject to speculation or even manipulation.
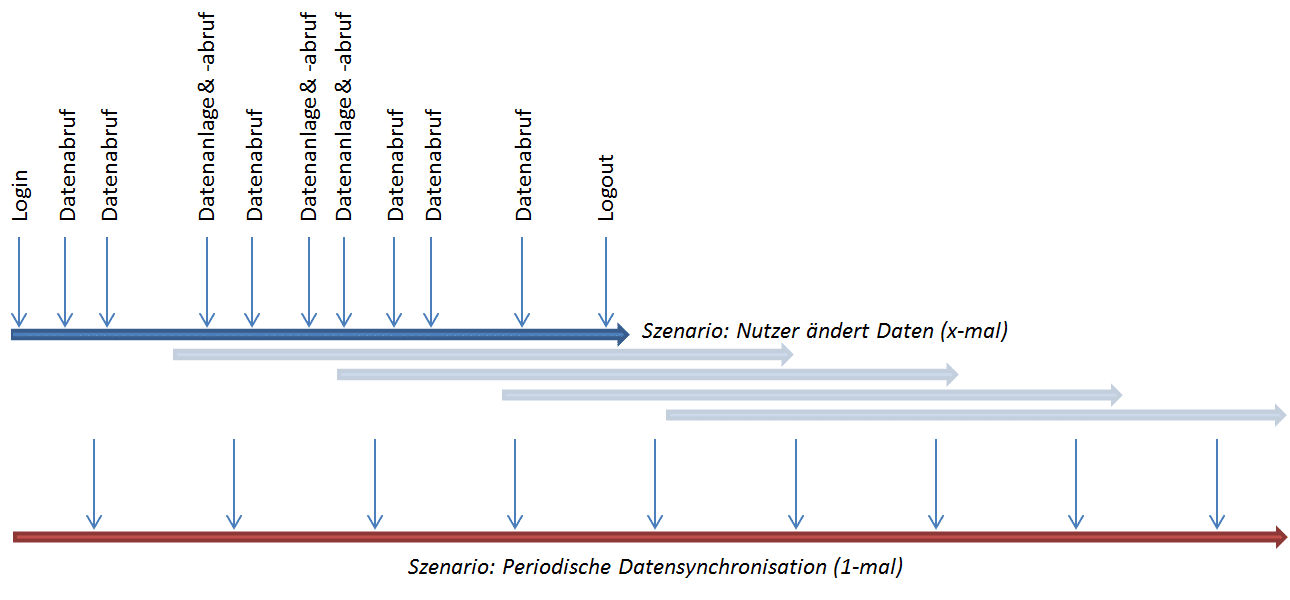
The graphic shows an example of the scenarios for a typical hour in the life cycle of the system. In addition to a scalable number of users reading and changing data, periodic data synchronisation with a third-party system is simulated to determine its impact on performance.
… and a small scale
Load tests examine the performance of a system as a whole. But what about system-internal measurements of runtime behaviour? These can also have their relevance, but should only be used in well-justified cases. One example is determining the range of variation in the runtimes of a defined function in order to find the cause for the different runtimes on the basis of the measurement results.
This so-called microbenchmarking must be done directly in the system. Since manually inserting code to measure the runtime of a function is usually not very practical, tool support should be used here as well, e.g. JMH in the Java environment.
However, microbenchmarking has its pitfalls when measuring performance. Depending on the runtime environment used, it may not be possible to determine the time exactly. Depending on the tool used, the code injected for measurement may remain in the system even after delivery, thus preventing a clear separation of test and production code. Before using microbenchmarking, one should therefore question very carefully whether the measurement is really necessary and, if so, for what purpose and at which points.
Do not lose sight of quantity structures
Our three questions for preparing the load tests have so far left out one aspect that is often forgotten: The response behaviour of a system depends on the performant implementation of the functions, but not exclusively. Often, with the number of data sets to be processed, the effort and thus the runtime behaviour increases quadratically or even exponentially. With small sets of test data, this is often not yet noticeable, and even at the start of production, there is often only a small amount of data to manage. The longer the system is in operation and the fuller the database becomes, the more likely it is that the effects of unfavourable implementation will become apparent; enquiries from customers complaining about a “slow” system become more frequent.
This effect must be prevented. It is important to take into account the later expected quantity structure already during the first measurements of the performance and to simulate a corresponding amount of data for the load tests. The simulation should be as realistic as possible, i.e. it should not use simplified “game data” but be based on real data with all its variance. Changes to the quantity structures, e.g. through corrected false assumptions or new user requirements, must be reacted to with adjustments to the simulated database. The easiest way to realise this is through a data simulator that provides a desired amount of test data at the push of a button.
Simulated construction measures (right) for a stress test in a system for construction site coordination. Despite the high volume of data, which far exceeds the current level (left), the client functions with sufficient performance.
Choosing the right basis
Load tests are used to assess the performance of the system against its current requirements when operated in its current or planned environment. But automated performance tests can do even more.
For example, if you are faced with the task of finding the optimal environment for your system, tests make their contribution. If we collect the scenarios created to measure the response behaviour with the simulated data and combine them with different platforms, we arrive at the sizing tests. These are used to determine the platform on which the system still works reliably when the system is fixed.
Of course, we don’t pull different hardware configurations out of the closet, but choose the path of automation here as well. Today, different platforms can be set up very easily in an automated way, e.g. with Terraform at a cloud provider. A larger platform is then only a question of configuration.
The sizing test therefore first creates an instance of the system on a defined platform, provides the data, carries out the tests using the load test tool and evaluates the measurement results. If the defined criteria are not met, e.g. the required response time is exceeded, the next larger platform is made available and the test begins again. Since all steps can be automated, the entire chain can be automated. The test stops when the criteria are fulfilled or the next larger platform is no longer available.
Making stress
Even though we now know what the optimal configuration of our system is to handle the required load, it is unclear how the system will react to overload. In order to be able to assess the behaviour of the system outside its limits and to identify possible problems before they occur in productive operation, the system should be subjected to a stress test.
The classic stress test is actually a load test that only generates more load in the form of requests to the system. In addition, however, the quantity structure can also be increased beyond the level for which the system is actually specified.
Stress can also be created by restricting the system in its basis. How does the system behave in the event of a partial failure or if the network connection to the database is interrupted? Techniques from chaos engineering can be a blueprint for your own stress tests in addition to classical performance tests.
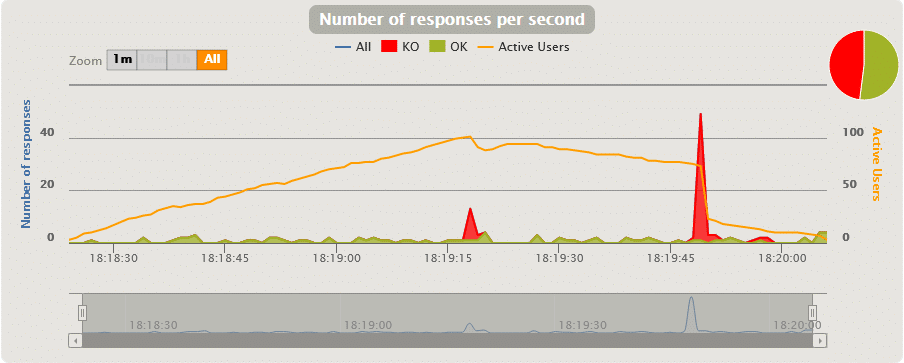
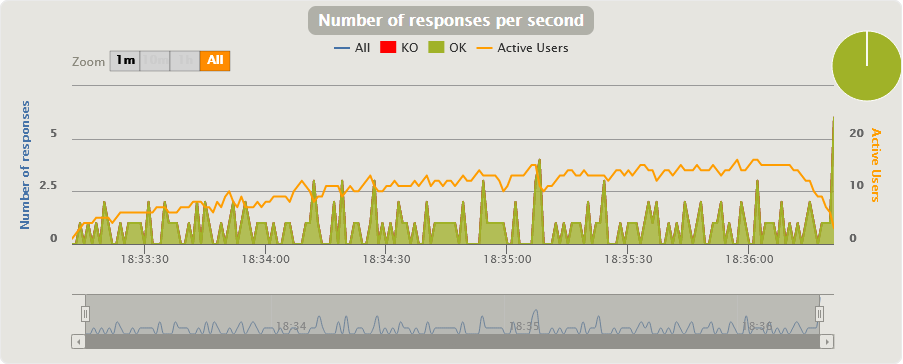
Both pictures show the same scenario, the retrieval of a defined amount of data by 150 parallel users (Gatling tests). While in the first test all requests go through, in the second test almost half of the requests fail with a timeout. The only difference between the tests is the different ramp-up times of the 150 users – 90 seconds in the first, 180 seconds in the second. By varying the tests (more users, more data, …), the limits of a system can easily be explored.
Know the users and their behaviour
The last aspect that influences the performance of a system is the user. Even if the performance requirements are precisely specified, the user may perceive the system as slow. Here it is important to find out how the perceived slowness comes about.
In addition, requirements change over time, which the development sometimes only learns about by chance. Specified limits of the system are exhausted and exceeded because it is possible. This makes it all the more important not to lose contact with the customer and also to consider technical solutions for monitoring the runtime behaviour, if this is possible. Modern monitoring systems make it possible to collect data in a targeted and anonymised way, provided the client agrees to this kind of monitoring. Bottlenecks can thus be easily detected, also in the historical view.
Conclusion on system performance
The load test and its siblings, the stress test and the sizing test, are important means of keeping the performance of a system under control. Used in a targeted manner and ideally integrated directly into the build pipeline, they are a building block for ensuring software quality and thus customer satisfaction.
Notes:
Are you also concerned with the topic of performance? If you would like to discuss load tests, stress tests and sizing tests, please contact Dr. Dehla Sokenou .
You can find more explanations (in German) about load testing and stress testing here.

Dr. Dehla Sokenou
Dr.-Ing. Dehla Sokenou feels at home in all phases of software development, especially in quality assurance and testing. At WPS – Workplace Solutions, she works as a test and quality manager and software architect. In addition, she is an active member of the GI specialist group Test, Analysis and Verification of Software and in the speaker committee of the working group Testing of Object-Oriented Programs.


