What is the Velocity?
Smartpedia: Velocity is a measure of the speed of development, based on realised story points and helps in planning sprints.
Velocity – the speed of the development team
The English word “velocity” means speed or rapidity. In Scrum, velocity or the velocity factor is the unit of measurement for the speed of a team. It is often determined with the help of so-called Story Points. Story Points are a unit for describing the size of a User Story and represent the development effort and the factors that influence this effort.¹ The survey of the average Story Points completed over a period of several sprints is a tool for planning future sprints.
Example:
In Sprint 1 10 story points are realized, in Sprint 2 even 16 story points. In the following Sprint planning, 13 story points are used (if the same number of employees and working days are available). In Sprint 3 19 Story Points are realised. The planning for the 4th Sprint is now based on 15 Story Points [((10 + 16 + 19) / 3) = 15].
Velocity in sprint planning
Regardless of the type of calculation, it is important for organisations to reflect the average velocity in sprint planning rather than the maximum or highest speed of recent sprints. One of the principles of the Agile Manifesto is to promote sustainable development through a steady pace that clients, developers and users can maintain over an unlimited period of time. Content is more important than speed and speed says nothing about whether added value has been created.
If the goal were to increase speed, there would be a kind of inflation of story points: a velocity designed to increase speed can be achieved, for example, by increasing the estimated values; this would counteract the purpose of estimation using story points. This also means that velocity is not a good criterion for evaluating a team. It is a flow metric of the team for the team and not a performance metric for management.
Comparing the speed of individual teams in an organisation based on velocity is also not a good idea. It is a team-internal tool for planning and risk control. Those who try to drive teams in an organisation by comparing them to each other based on planned or realised story points are not doing themselves any favours. This will also lead to an inflation of estimates. Here, both the Scrum Master and the developers are challenged to prevent this undesirable development as early as possible.
Interpretations of the Velocity
Is it possible to realise more Story Points than planned? Answering this question leads to two different interpretations and ways to calculate the speed:
- Some organisations consider the additionally created functionality, which is formulated by user stories and implemented accordingly in the sprints. If 5 stories with a total of 16 story points were planned into a sprint and implemented accordingly, then the velocity of the sprint is 16 story points.
- In addition to originally planned user stories and story points, other organisations also consider tasks that were added in the course of a sprint. Such tasks can become necessary, for example, through bug fixing or refactoring. So it can happen that a team can implement more story points than originally planned.
Visualisation of the velocity
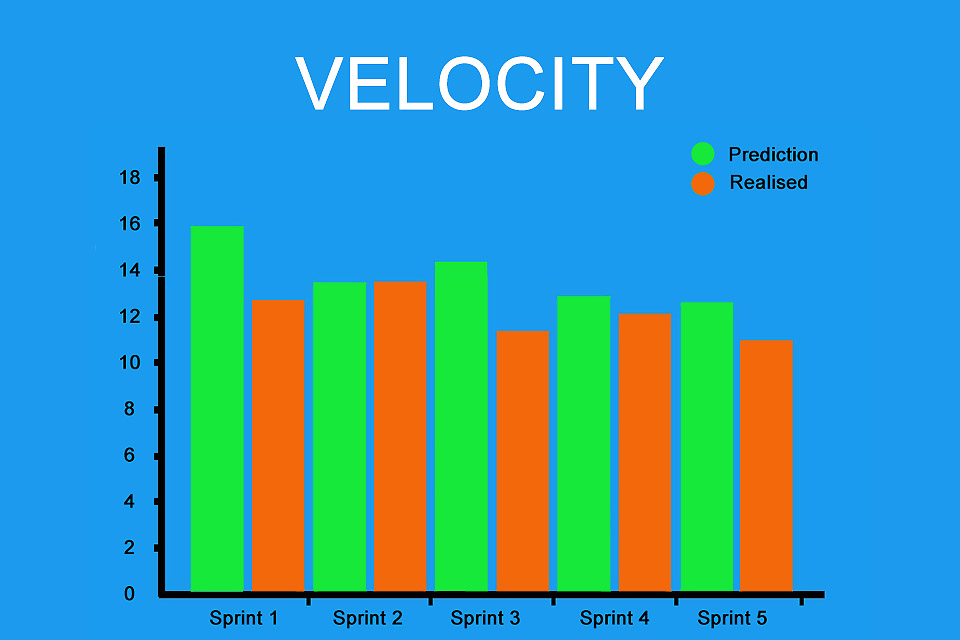
The speed is visualised with a velocity chart. The so-called velocity offset as the sum of the user stories not realised in a sprint can also be read from the chart. Here the development team – ideally together with the Scrum Master – should consider what the reasons for the deviation between the planned and implemented user stories or product backlog items are. Conclusions for future planning can be drawn from the findings.
Alternative metrics in agile projects
In many organisations, velocity based on story points is used to plan work. In addition, there are many other agile metrics that could be used:
- Backlog Health: a measure of the overall health and efficiency of the team’s backlog, including factors such as backlog size, obsolete items and progress towards completion.
- Cycle Time: the time it takes a team to complete a task from start to finish.
- Escaped Defects: the number of defects that make it into the final product despite the team’s efforts to avoid them.
- Defect Density: the number of defects per unit of work.
- Flow Efficiency: the percentage of time a team actually works to create value rather than waiting for resources or approvals.
- Customer Satisfaction: a measure of how satisfied customers are with the team’s work.
- Lead Time: the time it takes from a customer requesting a task until the task is delivered.
- Mean Time To Repair (MTTR): the average time it takes to repair a defect.
- Percentage of Rework: the percentage of work that is reworked due to defects or other problems.
- Team Morale: a general measure of team engagement and motivation, determined through surveys or other forms of feedback.
- Time to Market: the time it takes a team to bring a product or feature to market.
- Time to Value: The time it takes a team to deliver tangible value to the customer.
- Work in Progress (WIP): The amount of work currently in progress in the system. This metric can help teams recognise bottlenecks and reduce multitasking, especially when combined with the WIP limit as the maximum number of tasks a team can work on at any given point.
Certainly this list can be extended. The Scrum Guide does not define an explicit agile metric, so organisations have to decide on one or more metrics to plan and realise their work. Some metrics, such as cycle time or flow efficiency, have a direct influence on the results of a sprint. Others have an indirect effect, such as backlog health or team morale.
Velocity in practice
Here you will find some articles in English and German dealing with velocity in practice:
- The Colossal Danger inherent in Velocity – article by Derek Davidson on scrum.org.
- The velocity trap – article by Merlin Mechler in the t2informatik Blog.
- Agile Missverständnisse: Das Ende der Velocity? – article by Björn Schotte at Mayflower.
- Weekly Scrum Interview Question: What Is Velocity? – article by Alex Kudinov on scrum.org.
- Three Approaches to Estimating the Impact of Holidays and Time Off on Velocity – article by Mike Cohn at Mountain Goat Software.
- Was bedeutet Velocity für Ihr Team? – article by agile academy.
- The Illusion of Velocity – Beitrag von Stefan Wolpers auf scrum.org.
We would be happy to add more exciting contributions to the list.
Impulse to discuss
Notes:
[1] Velocity is not mentioned as a term in the Scrum Guide. Also the User Story and Story Points are not mentioned there. Nevertheless, all three constructs are often used in projects and developments that use Scrum.
Some publications speak of developer velocity. In most cases, this means the individual speed of a single developer.
“Scrum, The Art of Doing Twice the Work in Half the Time” is a Scrum bestseller. Here you can find an article about the agile speed lie.
If you like the article or would like to discuss it, please feel free to share it in your network. And if you have any comments, please do not hesitate to send us a message.
Here you will find additional information from our Smartpedia section:


